Thanks to all the participants of our node operator survey and thanks for being patient with us to present the results. With a couple of follow ups it unfortunately took us longer than expected to get the evaluation into a presentable format, but here we go:
The survey had two sections
- Understand the node runner perspective
- Understand the node setups
A note on the participants: We got feedback representing over 50% of staked POKT, nodes, relays and validators. There was a healthy spectrum of smaller (<10 nodes) and larger runners (>1000 nodes). The vast majority supported 15+ chains.
Note: In general, multiple answers have been possible (in cases percentages add to >100%)
1) Understand the node runner perspective
On the motivation to run nodes:
- Node operating business / profit aspects: 50%
- Project believer/support (incl. investors): 50%
- General decentralization: 40%
Pocket is the only source of node runner income for 60% of participants.
Continue node running support, even at a loss is 50/50 (yes/no). Those who would rather not continue are also split 50/50 between ‘going right away’ vs. ‘aren’t sure, would only continue for a short period’. With respect to unstaking in the case of stopped node operations less than 15% would unstake/leave right away (85% would wait and see, would make it dependent on how things look then).
Currently 75% use nodes for other purposes, even though most of that (40% of total) is renting to others and the altruist network. The remaining 60% splits ~50/50 between other web3 use cases (mostly blockchain validation) and non web3 use cases.
Regarding support of new chains, Participants don’t feel obliged to support new chains (anymore) and follow economic viability for that decision. Improvement suggestions entail signaling via stake, DAO approval and estimation of expected traffic (incl. geographic aspects)
On the question around observed inefficiencies, there are four areas
- Oversupply/supply inefficiencies (70% of answers)
- Need consolidation of nodes (-> higher stake, reduce chain nodes), esp. on low traction chains (-> staking floor/caps depending on utilization)
- Costly geomesh due to cloud setups (questionable to which extent it improves customer experience)
- Lack of elasticity and flexibility of supply
- Tokenomics (40%)
- Inflation
- Loss-leader gamification
- CherryPicker: dilemma of decentralization inefficiencies vs. cost/reward cutting (PUP32) vs. competitive SLAs (e.g. vs. infura) → relax CherryPicker e.g. anything <300ms should get rewards
- Liquidity issues
- Improve demand side (30%)
- Attract demand (e.g. get dApps to pay/add features)
- Increase presence on more protocols
- Communication (10%)
- Lack of transparency around management decisions (and too many personnel changes), issues and on the portal side
Consequently, the most important recommendations for the DAO (the one thing) followed the same four areas (+2 additional), however less on the supply side:
- Oversupply/supply inefficiencies (30% of answers)
- Sunset non high demand chains/ensure a threshold and enforce chain pooling
- Waiting ARR to prove it’s value
- focus on hobbyist/maxi crowd as less likely to clash with interests of network/DAO
- Set a cap on node runners and have rest participate by delegation
- Tokenomics (40%)
- model development for tokenomics is no community task
- Offset inflation with equal burn of portal fees paid
- Create more sinks (beyond locking)
- Improve demand side (30%)
- promoting/explore/incentivize adding new features to attract more (and bigger) dApps
- Demand orientation: what quality/quantity of service is needed for demand and build out supply to serve that
- Communication (20%)
- Clear roadmap needs to be shared, so less short term sighted discussion in forums
- DAO cannot make massive sudden changes like PUP32 again - losing credibility/trust of long term investors
2 additional aspects:
- Improve Treasury fund management :
- Cut costs: Quantify things we are funding
- Bring idle capital to work, e.g. DAO loaning out POKT to verified members
- Code ownership/reliability:
- No official supported version of mesh
- not clear if lean is maintained by PNF.
Further recommendations for the DAO beyond the above followed also the four areas:
- Oversupply/supply inefficiencies (30% of answers)
- Simplify multiplier and increase minimum stake (substantially)
- Enforce chain pooling and single region staking (minimize operational costs via ‘running nodes from home’)
- Penalize running from public IPs
- Decrease #stakable chains (e.g. max 5)
- Tokenomics
- Cap on rewards based on relays, so node runners get sufficient rewards for infrastructure
- More money for supply side (didnt get why thats driving pokt price)
- ARR right direction, even further inflation reduction
- Think about escape hatch for excess staked pokt (oversupply)
- Alternative use for anticipate selling after pup32 (e.g. first on LPing into wPokt pools)
- Get v1 out ensured good supply/demand tokenomics (e.g. build-in burn, stakes necessary to send relays)
- Improve demand side:
- via marketing channels
- usecases that increase velocity and/or sinks and POKT buy pressure (“supply side does not matter at this point)
- Competitive pricing (with reliable/scalable supply of services)
- promoting/explore/incentivize adding new features to attract big dapps and attract more dapps
- Communication/processes
- More transparency on daily traffic changes, what PNI charges for the traffic
- Audit chain listings moving process to proposals/DAO votes to turn chains on/off
- Other:
- Project needs to survive into next bull market
2) Node runner setups
Amongst the ~50% of stake represented, ⅔ on bare metal, ⅓ on cloud. The bare metal setup is often a mix of proprietary equipment and rented servers. The cloud setup is mainly on demand on AWS, GCP and Hetzner.
Outsourcing is barely practiced (<20% of nodes/stake (i.e. ~10% of total) and almost no pooling (<5% of nodes/stake). Also redundancy is typically not put into place, but the ~20% of nodes/stake (again ~10% of total) that do, mentioned they have fallbacks on every chain node.
Unfortunately too few responses on the split per region and/or chains, which is why below aggregates to be taken with grain of salt as both setups and costs provided had a wide range. (the split data we got showed less surprising relationships like lean servicers running at a fraction of cost to chain nodes)
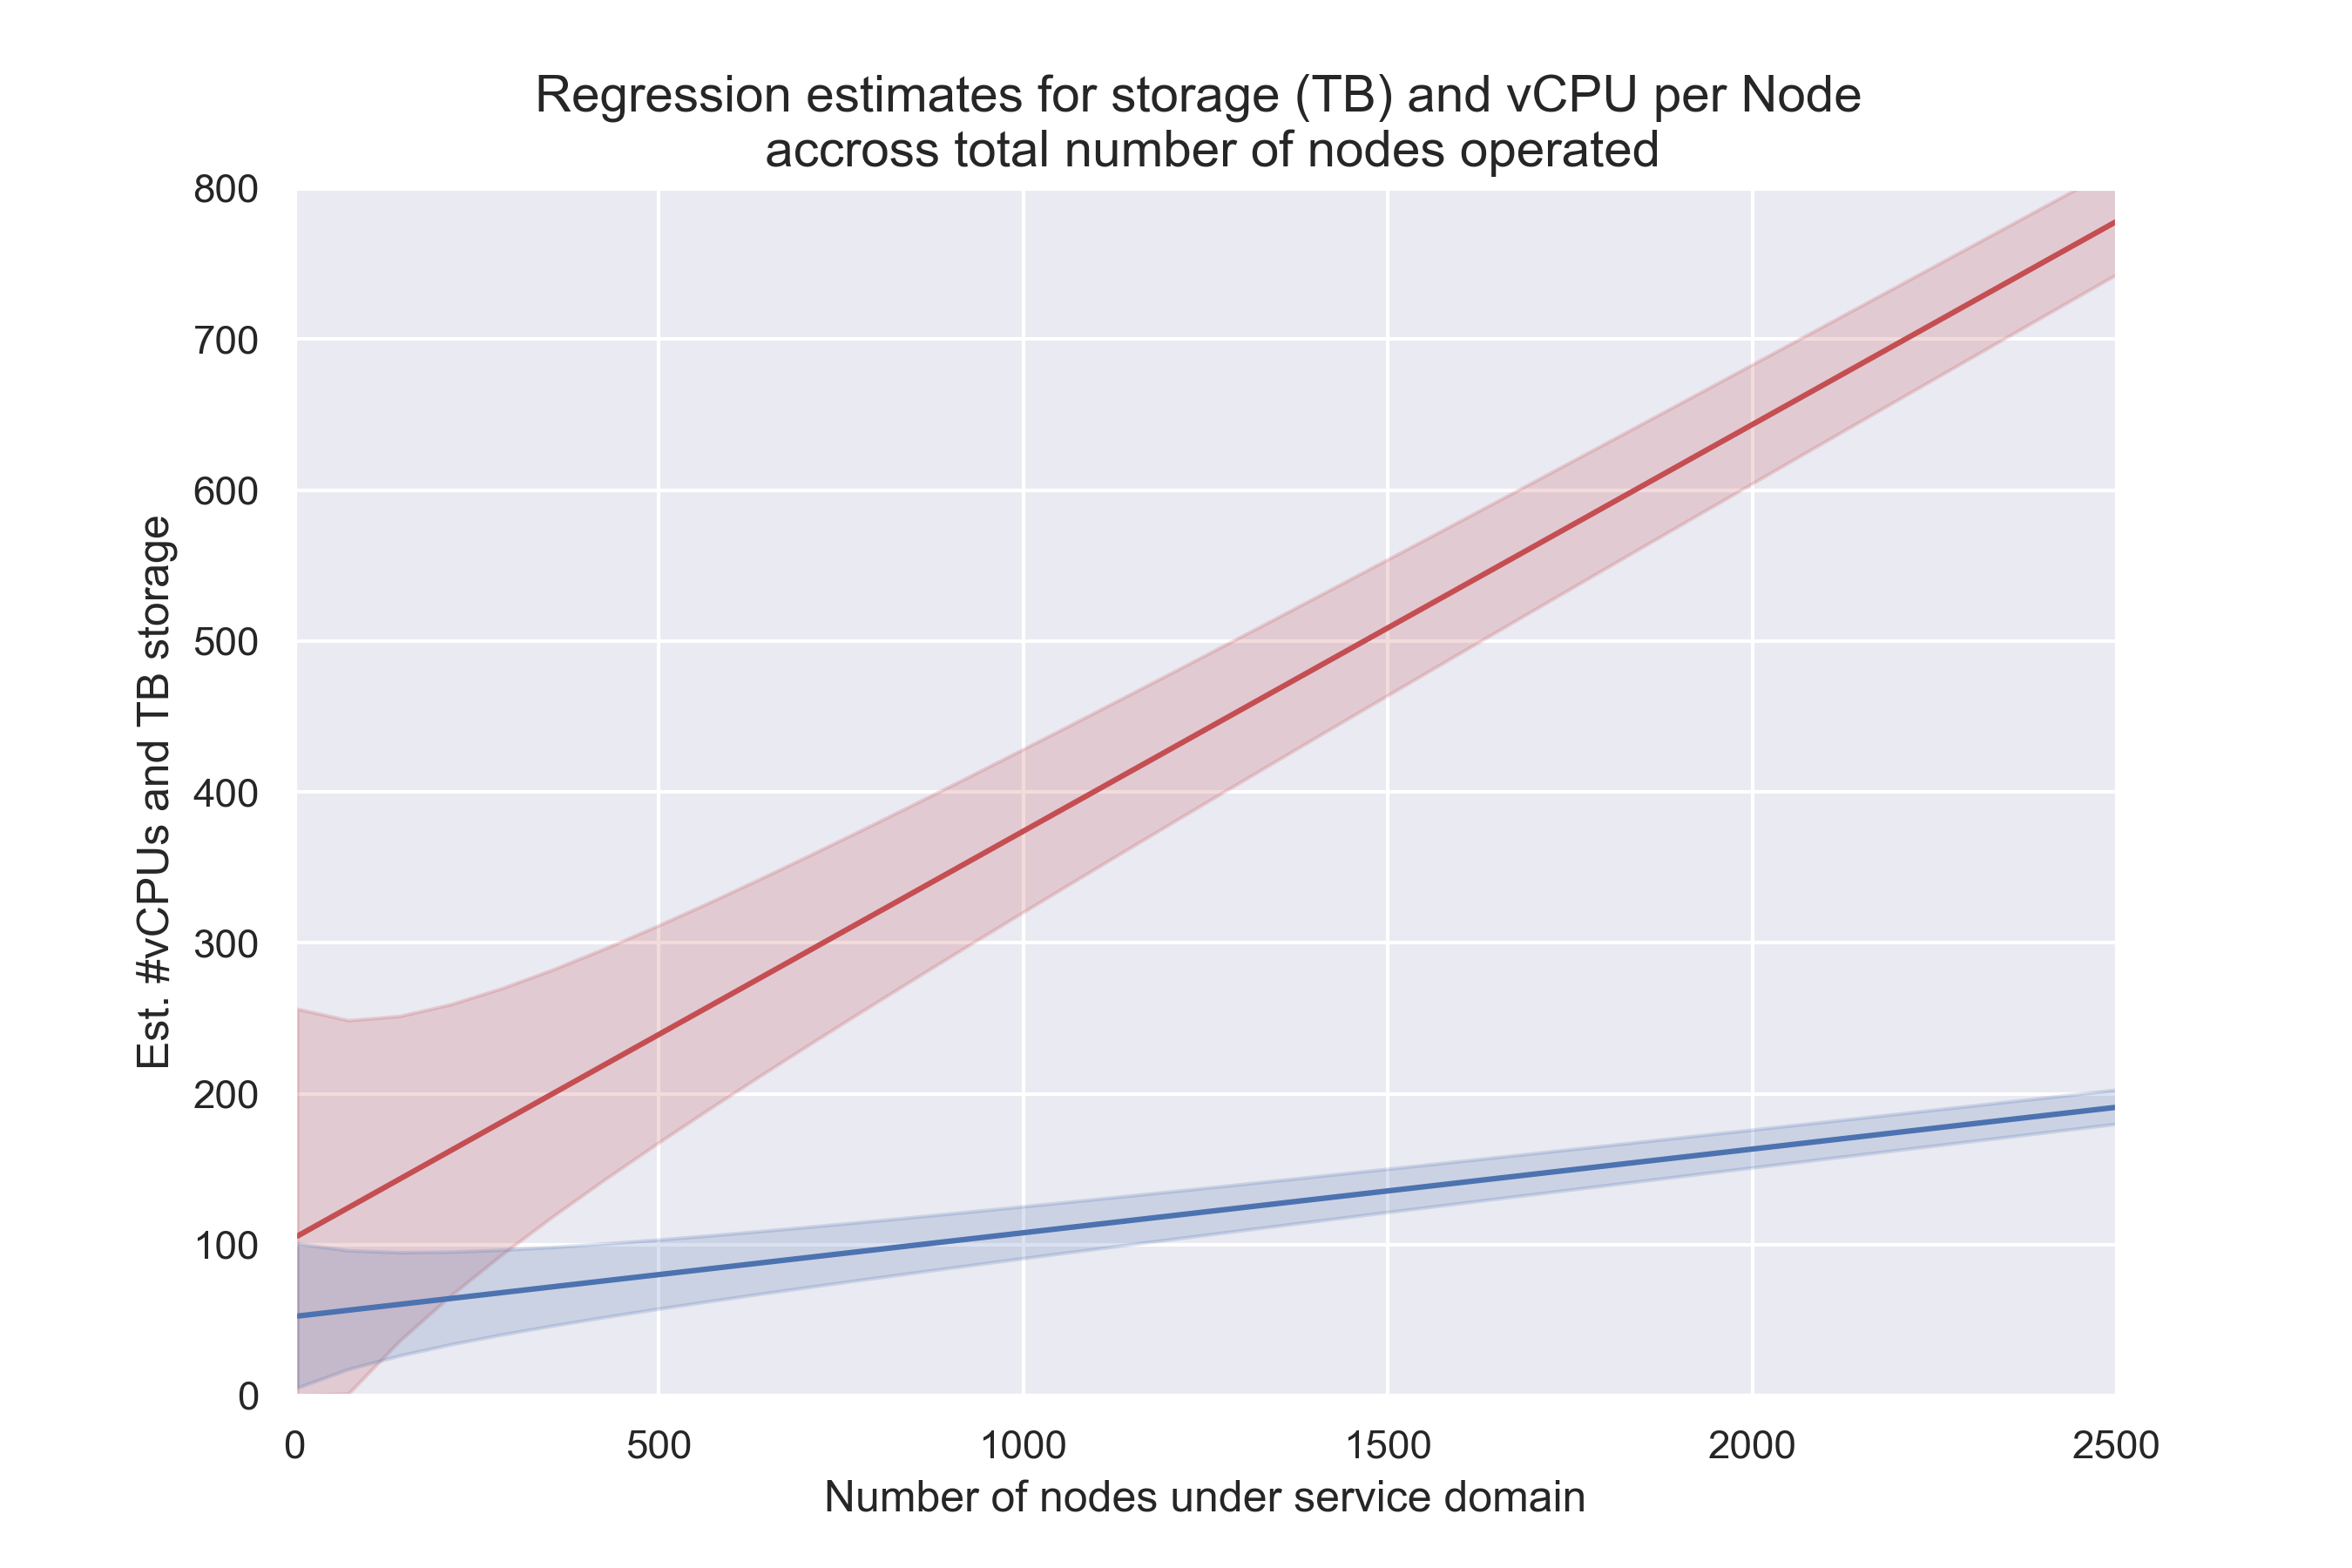
There is some (expected) linear relationship of #vCPUs and TB of storage, yet with wide dispersion especially for the CPUs (see chart below). This was mainly impacted by the number of chains supported. The storage utilization across responses was in similar ranges of 60-80%. (for fans of statistics: R^2 for vCPU regression is 0.82 and for storage it’s 0.71)
The Bandwidth was mostly either 1 or 10GBps (all bare metal setups unmetered), with region-dependent some with 3GBps.
The working hours spent on operations per month were quite wide ranging:
Hours/month:
| <100 nodes |
5-10 |
| <1000 nodes |
15-150 |
| >1000 nodes |
50-350 |
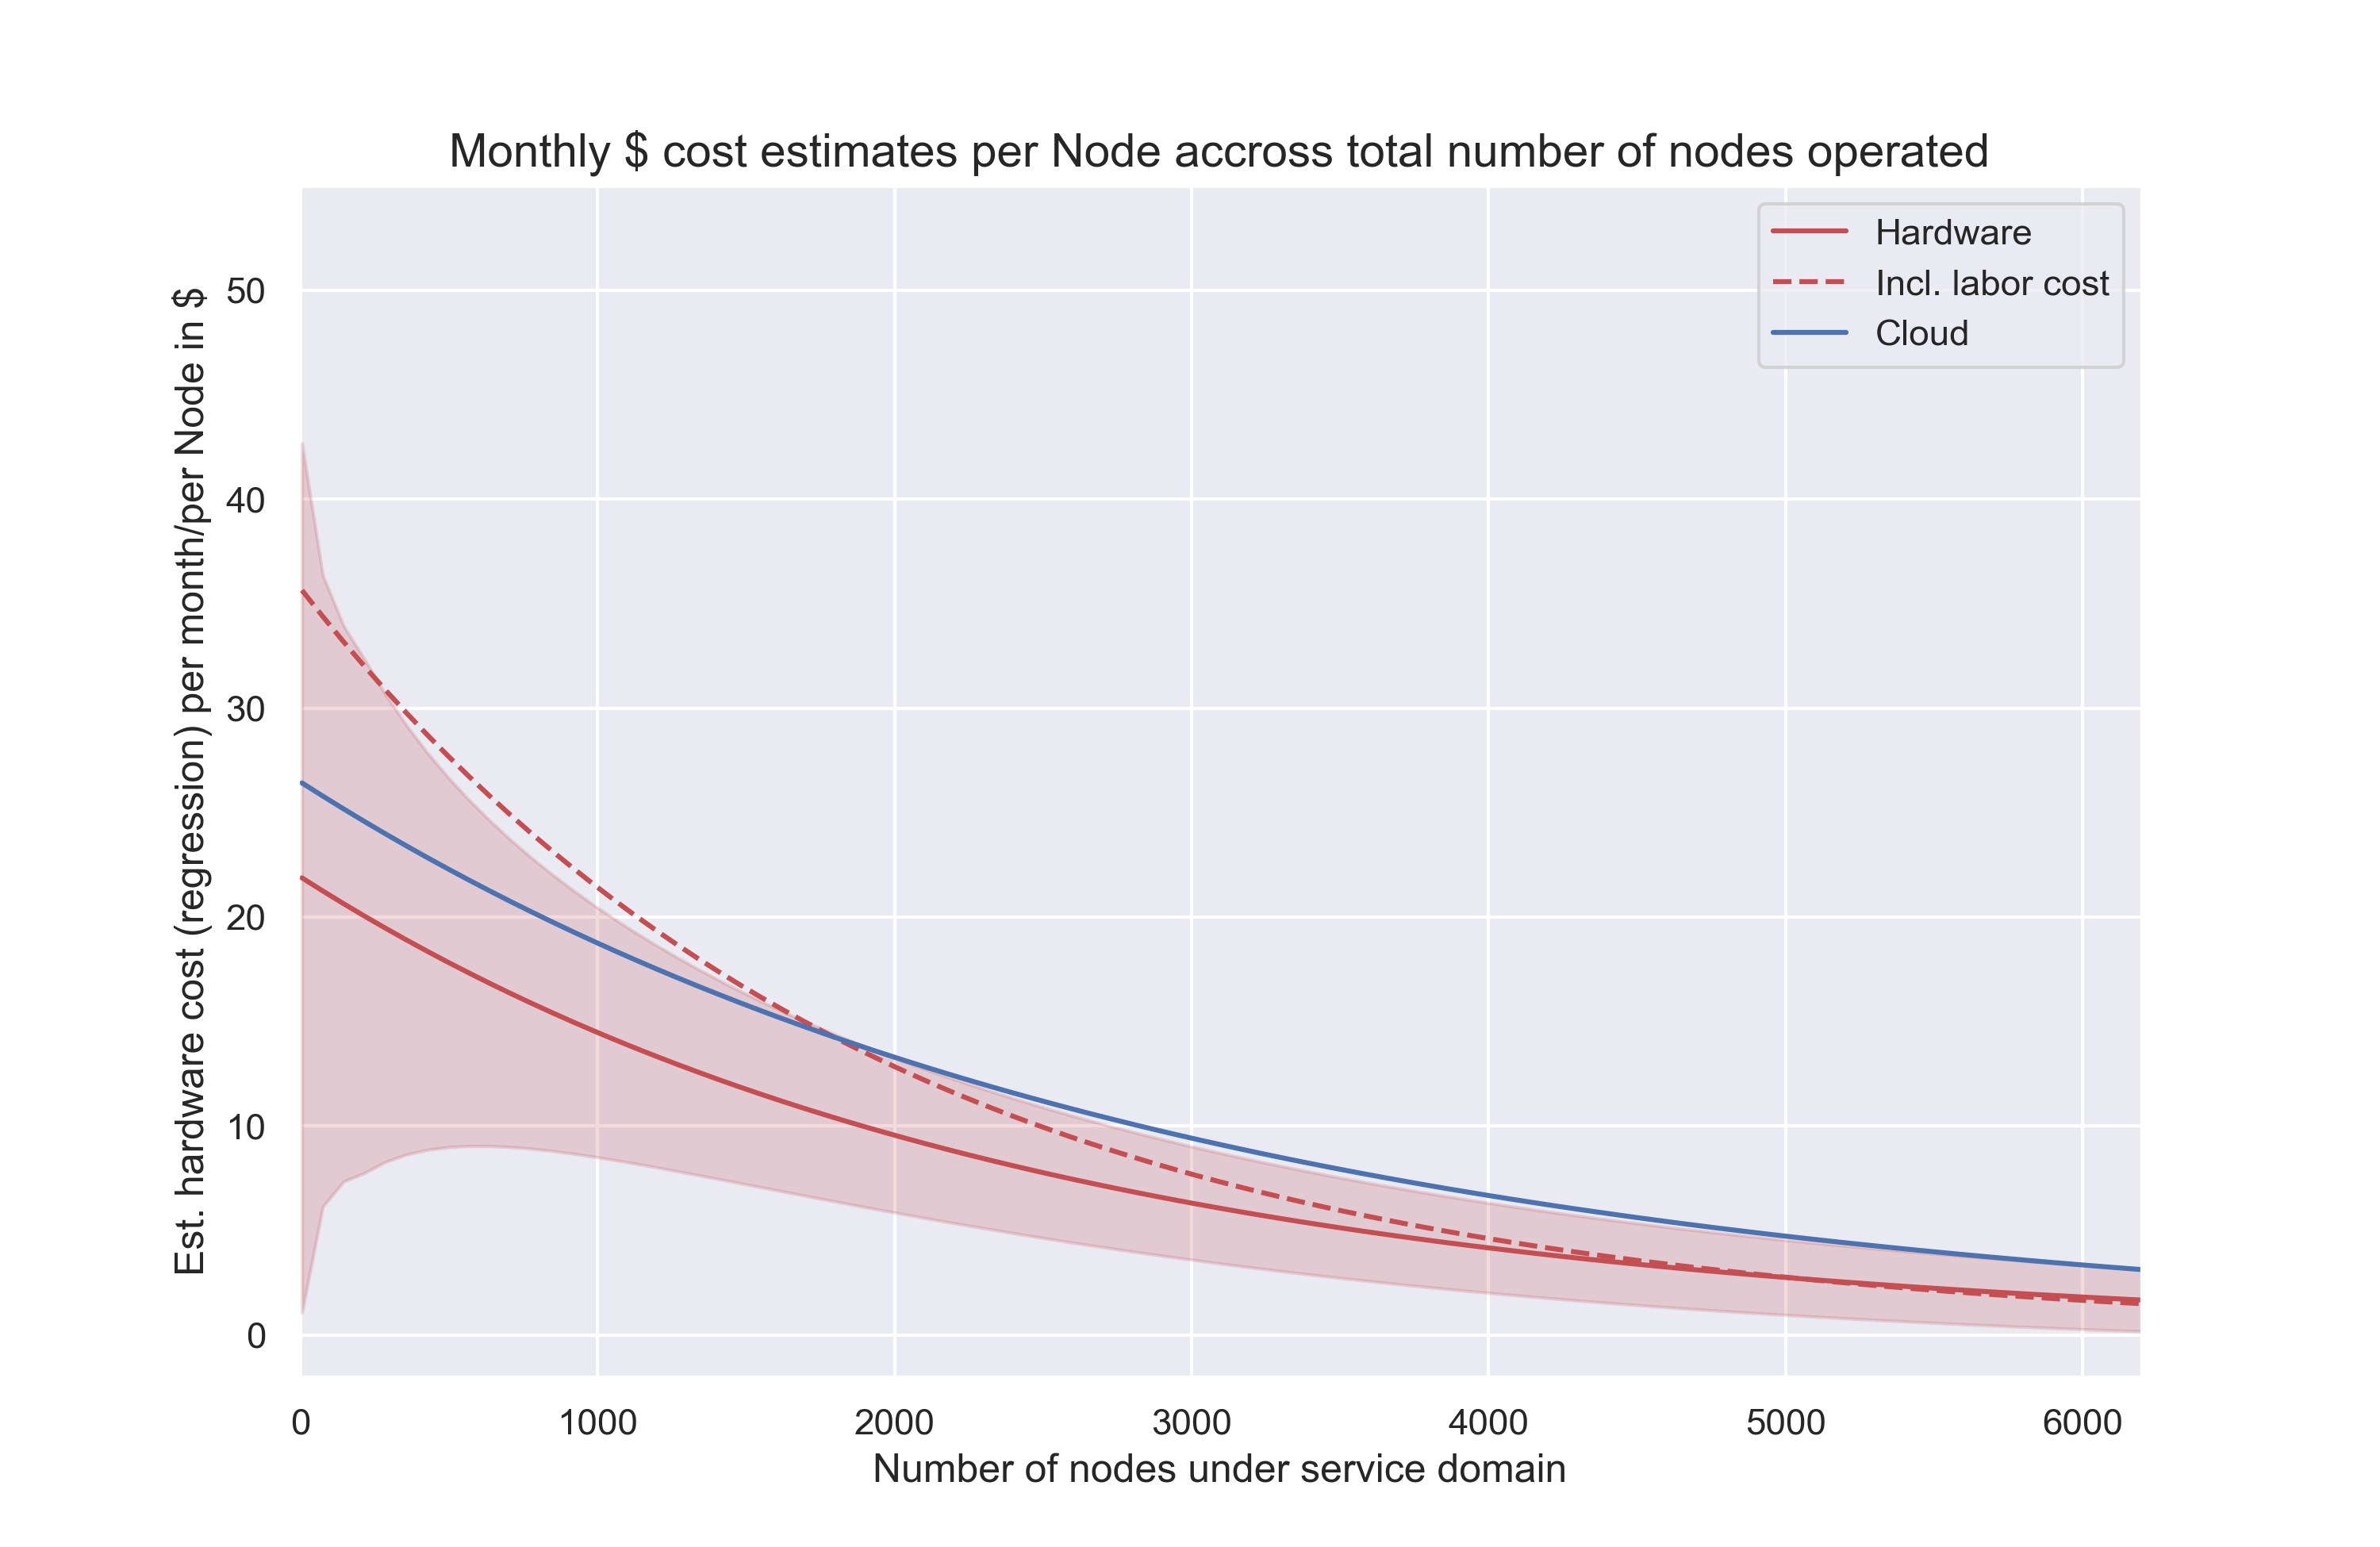
Overall costs for hardware per month per node showed exponential decline over the number of nodes a domain/node runner operated (R^2 = 0.75 for regression in below chart) . Cloud-based runners with a constant premium of 3-5$:
The red area around the regression line represents the standard deviation of the estimates. It is larger for smaller node operators as we don’t have a fully representative set of survey respondents reflecting the actual node operator distribution (i.e. whilst having a couple of larger node runners answering the survey, we didn’t have a corresponding large number of smaller node runners in the survey).
We converted the labor hours into monthly dollar costs per node assuming an hourly wage of 40$ - the potential error bar around those estimates (added to hardware as dashed line above) is similarly large for smaller node runners, yet it is quite clear that those hours significantly contribute to the overall operational expenses (under that wage assumption).
It makes sense that labor cost scales exponentially with the number of nodes a node runner operates. Hardware costs per node should become more constant after a certain size and anyway depend on the regions and chains supported (unfortunately we don’t have a detailed breakdown here). Whilst these observations on those economies of scale are less surprising, having some estimates can help to get a sense on the overall network costs for running the node infrastructure and even contrast this to income in Pokt rewards.
This is beyond the scope of the survey though, which is why we added this as a separate appendix.
3) Wrapping it up
Whilst less revealing that the largest cost drivers (if allocated per node) are chain nodes and labor, the survey helped to get an understanding on how node runner setups differ and how those cost drivers relate to each other. Unfortunately, we didn’t get a more nuanced understanding around differences by supported regions and chains.
Surveyed node runners see most inefficiencies on the supply side with multiple suggestions to tackle those cost drivers. Knowing how reducing these might impact the overall network should help with prioritizing. Additional emphasis on how to improve the network was put on the demand side and tokenomics and should be discussed to enable profitability across all sizes of node runners (and already are, see relevant projects here and here).
There are however expenses the network likely won’t be able to overcome: “All told where are your biggest expenses?” Answer: “Time away from the wife and kids. She’s not a fan of my node project (she doesn’t share my passion for crypto or decentralization) as it takes me away from changing diapers.”
Thanks again to all participants for trusting us to conduct this survey. We look forward to hearing your thoughts on the results and discussing how we can leverage these insights to improve the Pocket Network node ecosystem!
Appendix
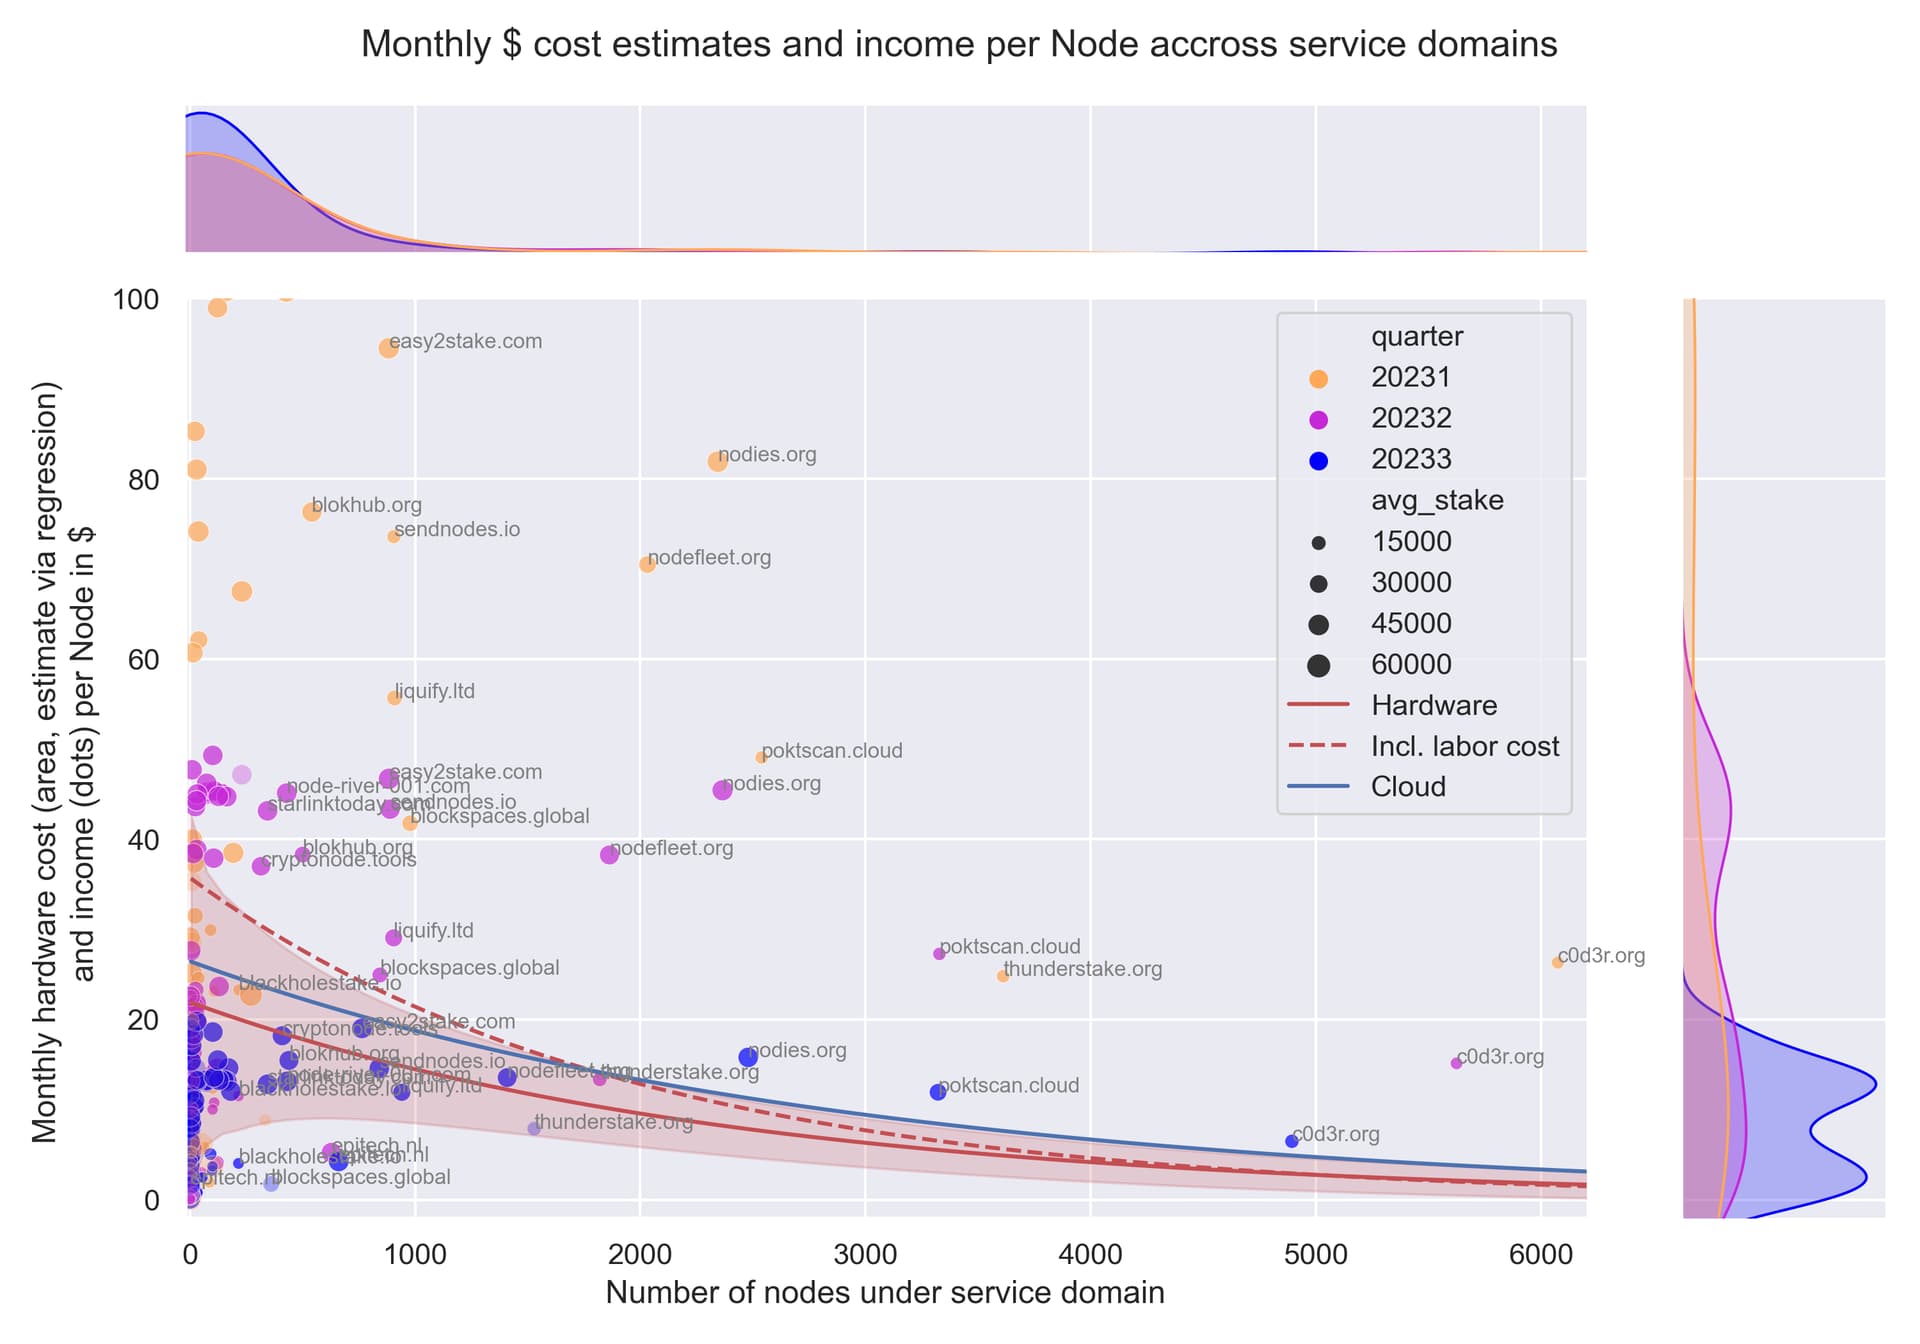
Using the $-cost estimates from above we can contrast that range of costs (red) to incomes (converted into $ using average prices) over the past quarters:
(income data via poktscan API, using ‘GetRewardsByGranularityForSelectionBetweenDates’)
Slightly shaded bubbles show node runners that stopped being active in that quarter. Some node operators in Q1 with monthly rewards >100$ are not shown.
As noted above, the uncertainty for smaller node runners is higher given the under-representation in the survey. This makes it also hard to conclude how impactful the recent decline in income is related to their cost range overall.
Obviously, price and emission decreases caused the overall incomes to decline (visible in the distributions on the right hand side).
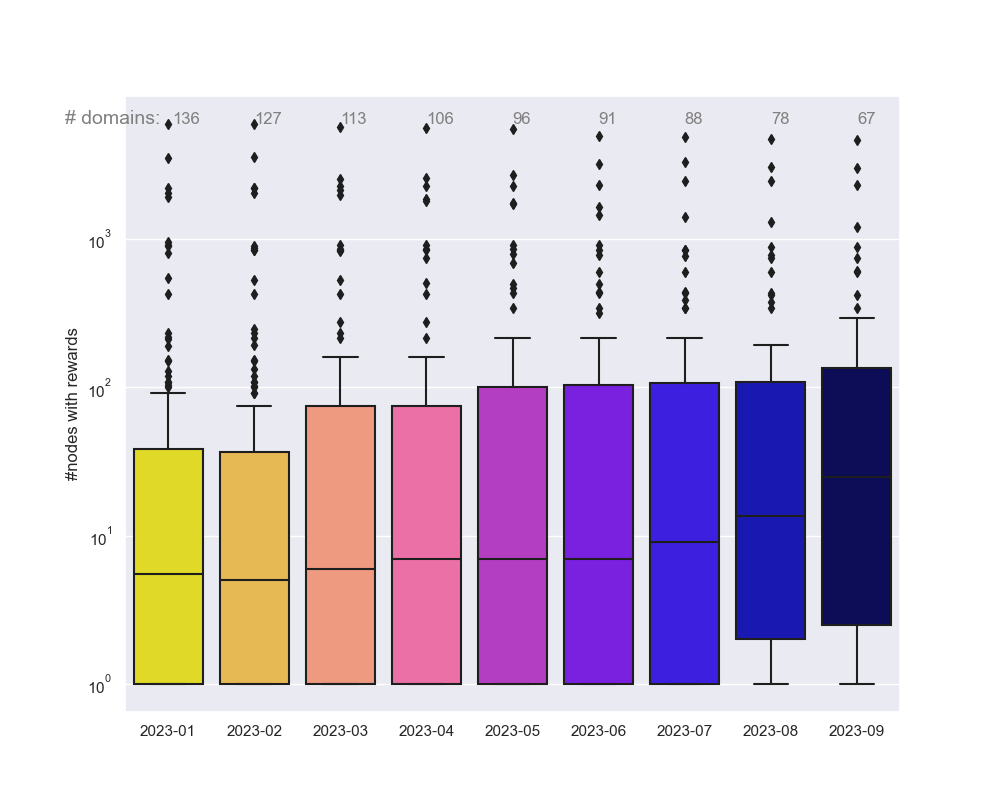
Not directly visible is the consolidation that happened on the node runner side (upper histograms), this is especially true if we just look at nodes (and their domains) that actually earned rewards. Below shows the distribution of how many nodes per service domain earned rewards:
Note also: On the one hand the above trend is related to node runners reducing their operations (and that actually both for smaller node runners (<100 nodes) and larger ones). On the other hand there is also quite a large number of node runners (~70 by end of September, typically <10 nodes) that no longer earned rewards with their nodes (despite not unstaked).
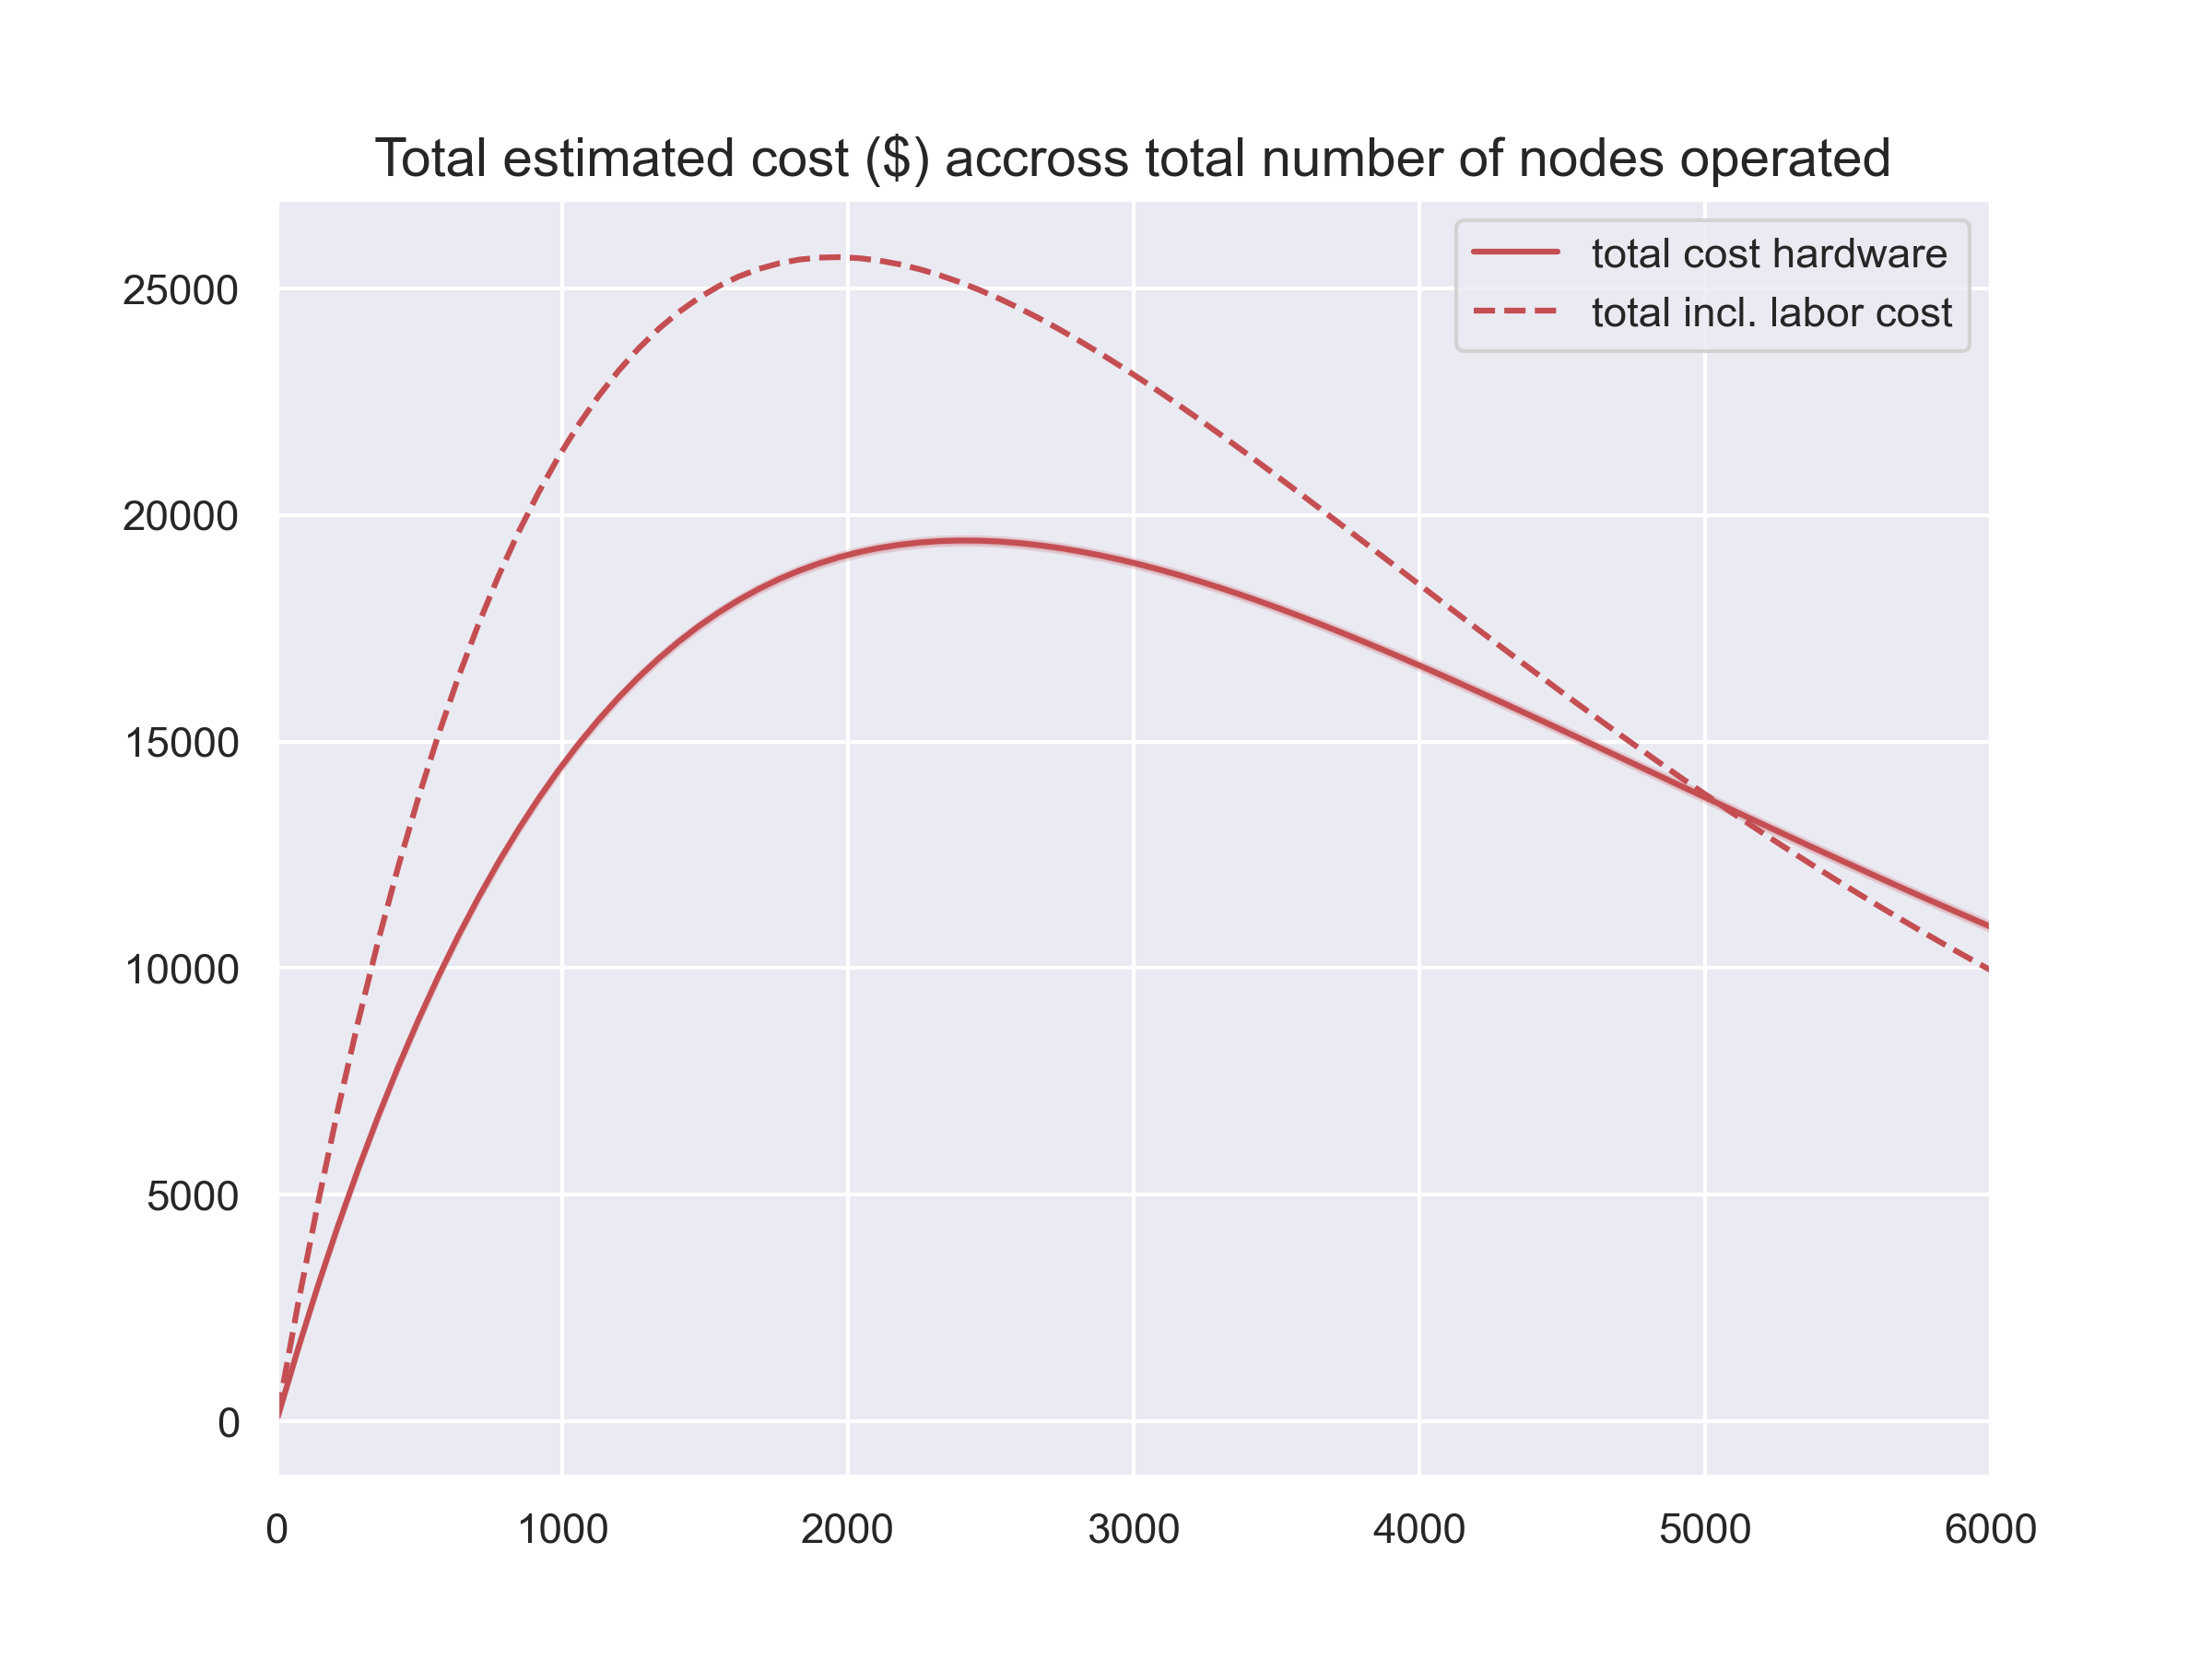
If we take the average cost estimate per node from above to model Node runner costs, there is two consequences:
-
The total cost for hardware of a node runner peaks around 2.5k nodes (and more like 2k nodes if we add the labor costs - this dashed line going below the solid line of hardware costs shows the limitations of such regression/extrapolation of data)
-
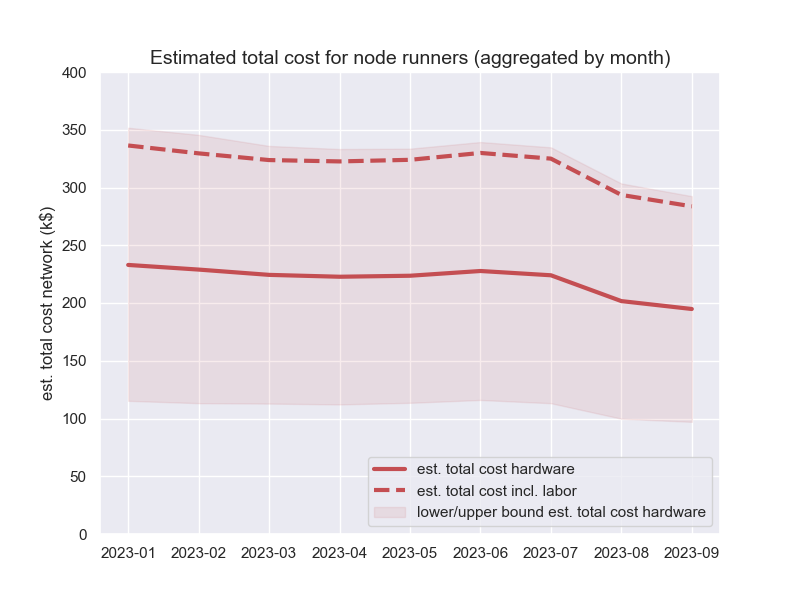
The consolidation shown in figure 2 also leads to decreasing overall network costs
The emphasis for the above is on the ‘if’, given the setup (and hence related costs) heavily depend on the regions and chains supported, which unfortunately we don’t have a detailed breakdown. Hence, we don’t want to draw much conclusion around e.g. the shown peak of costs around 2.5k nodes and the cost/node trend above.
Also, these are just costs related to running nodes. Not included is e.g. the opportunity cost of staking POKT or the overall cost to operate the Gateway, hence the numbers of the last chart are not (estimates of) the total cost of the Pocket network.