This is a fair and prescient concern that you raised. I have confidence in the caliber of our community that if a legitimate, peer-reviewed, substantiated and verified need to drastically lower the exponent can be found, while they would not be happy they would not block the change. That being said, I stand by my original reply of being confident that any such need to modify the exponent that may arise will not be found to arise with anything so drastic as 0.7 but would be much more modest such that it would in reality lead to much less friction than feared.
1 Like
In starting to relook at the pdf I got the impression that it would be important to go back and absorb poktscan’s May Infracon whitepaper and presentation before proceeding. I’m going to pause for a day or two to try to really understand the May whitepaper and its implications for the topic at hand.
I will not go through all the answers since my last post in order to keep this post concise.
First I want to say that the personal attacks are not useful for the community. As a community we need to try our best to keep discussions polite and within the topic at hand.
I’m relieved that the topic shifted rapidly and regain focus on what is important; proving right or wrong the issue that we are observing. Thanks @poktblade and @StephenRoss for taking the time to go through the our document and give your opinion. Also I thank @msa6867 for agreeing on giving a second look to our document, as he is one of the most prepared contributors of our community.
We have no problem with going through a review of all the data or performing new experiments and metrics to clarify this issue. Thats the way knowledge is built. We are currently tracking the nodes provided by @steve (and 20 more of our own nodes in a similar set-up). This is a long running experiment that we hope will give us some hard evidence to work with. We also are talking to other community members in order to produce new metrics, some of which we have not thought of. We even have an open channel with @msa6867 and we collaborate with him directly outside the public channels.
Finally I want to say that we can use this subject to create further division in our already small community or to help us consolidate our community knowledge.
It is not important whether this proposal passes or not, as long as the arguments of each side are defended with data and respect.
1 Like
I’m also convinced that we’re all on the same side and want the same thing - clarity and fairness. Thanks for reminding us that we’re all aligned here.
It seems that the root issue is that tracking rewards and understanding the math/ models behind them has gotten too complex for many of us - or maybe just me. I used to feel pretty confident about my understanding of why my nodes were over/under performing - I’m not so confident anymore. For the same reason, I can’t take sides on this proposal and would have to abstain from voting if this was put to a vote now.
Thanks for the comments @beezy - I would also love to see collaboration to validate some of the math/models, and hypotheses. I’m trying to figure out how we can validate in a way that is not subjective, easy to understand, and backed by concrete data.
To that end, perhaps everyone could answer a couple of simple questions to see if we all agree on some basic assumptions?
First Question
If I have 60K POKT to stake, I should see similar rewards if I choose to stake four 15K nodes, two 30K nodes, a 45K and a 15K node, or one 60K node. And this should hold even I have 600K or 6M POKT to stake. This is assuming of course that all of the nodes are configured exactly the same way - for example if all the nodes were running on a single server running LeanPocket. Do we all agree with this?
Second Question
If all the nodes are configured exactly the same way, they would have the same QoS. Is that a good assumption also?
All I’m trying to do at this point is validate those two assumptions and it’s the purpose of the test I’m running. If we all agree with those basic assumptions, I’ll share the addresses of the 250 nodes that we’ve rolled out for the test and everyone can monitor the results over time and see what we see.
If anyone doesn’t agree, please suggest how a test might be setup in a way that is not subjective, easy to understand, and will provide concrete data to validate outcomes.
We all have the same objective here, let’s work together and figure this out.
3 Likes
Yes. I agree with your assumptions/questions.
and I look forward to tracking your results.
I caution you to be careful of early results as the variance of a 250 node set can take quit a while to settle out. I’ll try to find you a formula so that you can compute the P value yourself.
Just for fun
: Here’s a 24 hour picture of the variance between buckets among the (anonymized) major providers. All of them are significantly more than 250 nodes.
2 Likes
Re first question: I would say that yes, theoretically they ought to see similar rewards whether 4x 15k, 2x 30k, 60k, 15k+45k, etc. And by “theoretically” I INCLUDE meaning to say that all possible second order effects that may have bearing on the system as a whole ought to have zero bearing as pertains to identically-configured nodes. The only reason I equivocate with the qualifier “theoretically” is because there is so much variation in the random rolling of the dice that splitting 250 nodes into two 125-node groups is borderllne in terms of being able to build up a sufficient set of data that is statistically significant in a time period that is short enough to be considered static.
Here’s what I mean. Suppose that you had done the experiment in April so that PIP-22 has absolutely no bearing on anything, and you randomly split your nodes (assuming they were identical) into two groups of 125 nodes. I would expect that on any given week you may see up to 30% or more variation in rewards between the two groups just from the simple variable of rolling the dice. I’m guessing it would take about two months of data collection to even out those random variations to draw any interesting conclusion. And you are at the mercy of the system remaining more-or-less static during that period.
Suppose on the other hand that new nodes are actively being added to the system so that the system is not static over two months. Then the random rolling of the dice that randomly favored one half over the first couple weeks gets less chance of of evening out later on because later on there are more competing nodes… in that manner pure randomness can get baked in over time and not even out.
Nonetheless, I think 250 nodes, if identical, should give some interesting results over a couple months. And if there is another node runner with say 1-2k identical nodes then all the better as we can probably make due for them with a few weeks of data given their larger sample size.
Re, “if all the nodes were running on a single server running LeanPocket” I would say, “especially if all the nodes were running on a single server running LeanPocket”, as the more that can be confirmed to be identical in configuration, hardware and location, the better.
Re second question, I would say yes, with the same caveat re gathering sufficient statistics (eg at least two months for comparing two test groups of 125 nodes each, etc.) I have not done the math to figure out how big the sample size (nodes x days) needs to be to draw statistically-significant conclusions and it is no trivial task to do so given how many moving parts of variability there are in the system. Especially given the effect that someone mentioned earlier where say USA based nodes may get called on to service relays in asia and have bad QoS stats compared to identically configured nodes that serviced relays in usa. It takes quite a large sample size to even that kind of stuff out. Of course we can look at QoS on a per-region basis to get rid of this effect but that means all the more days of data collection need to be gathered to get a sufficiently large sample size.
In your case, since you are looking for statistically-significant variations between bins, you have to consider the node count per bin to figure out how long you need to collect data before you can draw any conclusion. Last I checked you have about 40 in bin 4, 40 in bin 3, 60 in bin 2 and the rest in bin 1. I really like the more or less even spread between bin 2-4. That helps. But 40 nodes may not be enough to have 2 months be enough data collection. Its hard to say. I think your best approach is to randomly assign identically configured 15k nodes into different groups of approx 40 nodes each. Once you collect enough data such that the statistical variations between your purely random groups of forty 15k nodes is sufficiently small, that can be used as a good empirical argument to say that your bin 2-4 groupings have also reach a sufficiently large sample size to test the hypothesis of whether or not there are bin-related variations. Hope that makes sense
can you describe the setup?
Thanks for the clear/direct answers @BenVan. If you could suggest how long you think we’d need to run the test to be confident in the results that would be super helpful. Thanks again!
Thank you for your responses also @msa6867 - although I read your response as a solid “maybe” - I’d like to get a consensus on what we think will work to remove any subjectivity when we see the results. If what you’re saying is that you believe there is no way to accurately determine if PIP-22 is working the way it should be - that’s a bigger issue in my opinion. But to confirm that’s not what you’re saying, can you tell us if you think it is possible to conduct a test like the one we’re discussing that will tell us definitely if PIP-22 is working the way it should be? If so, can you also tell us, in as few words as possible, what that test looks like?
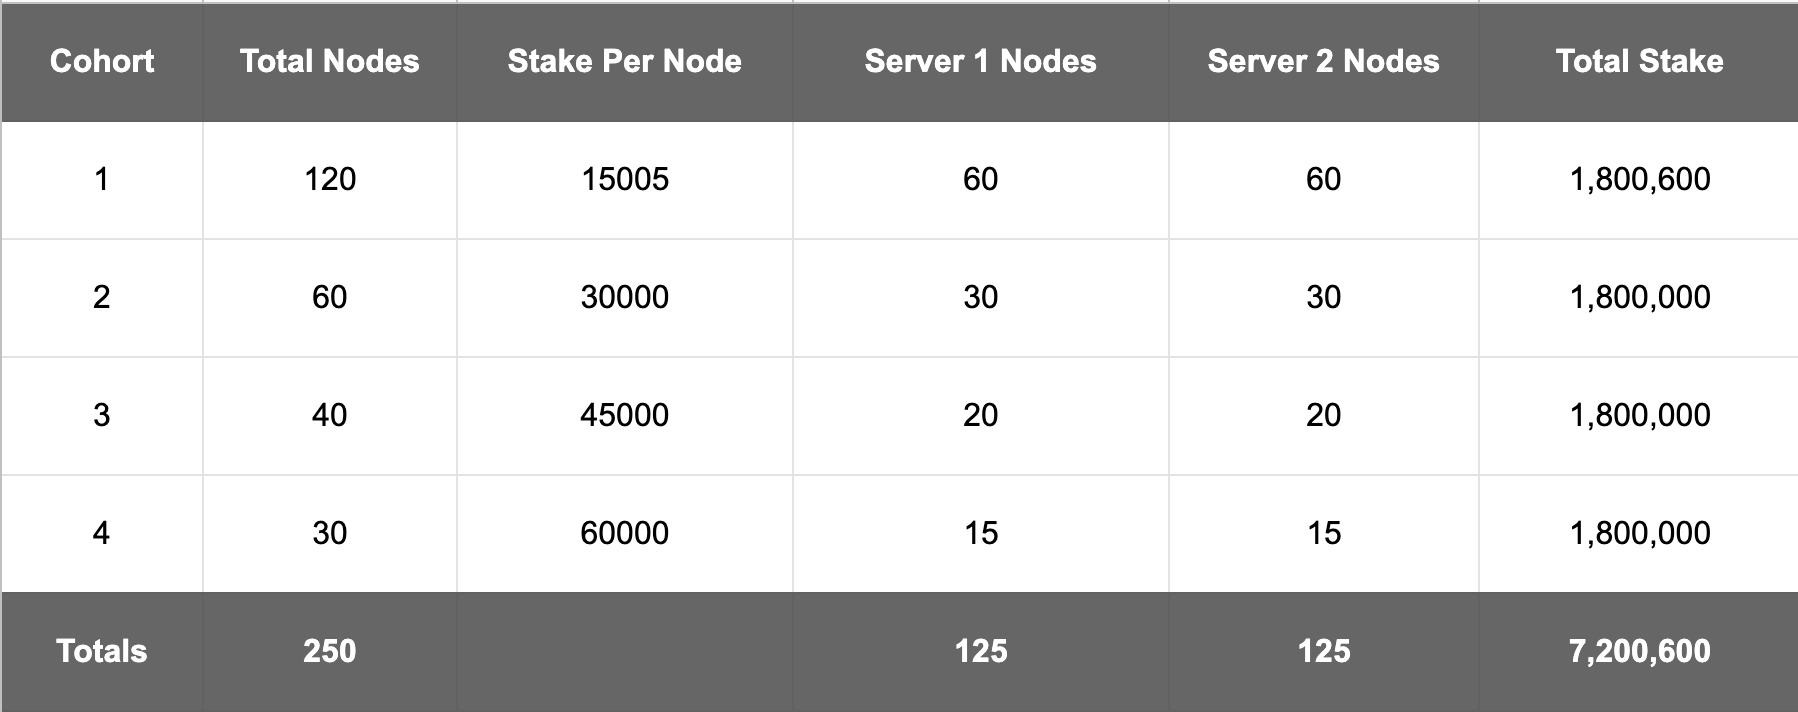
Here is more detail regarding how the test is set up. As, I’ve shared, there are 250 total nodes representing a total stake of 7.2M POKT.
NOTE: The 15K nodes actually have 15005K staked to provide a little buffer over the minimum stake threshold which is why the total in the chart below shows 7.26M
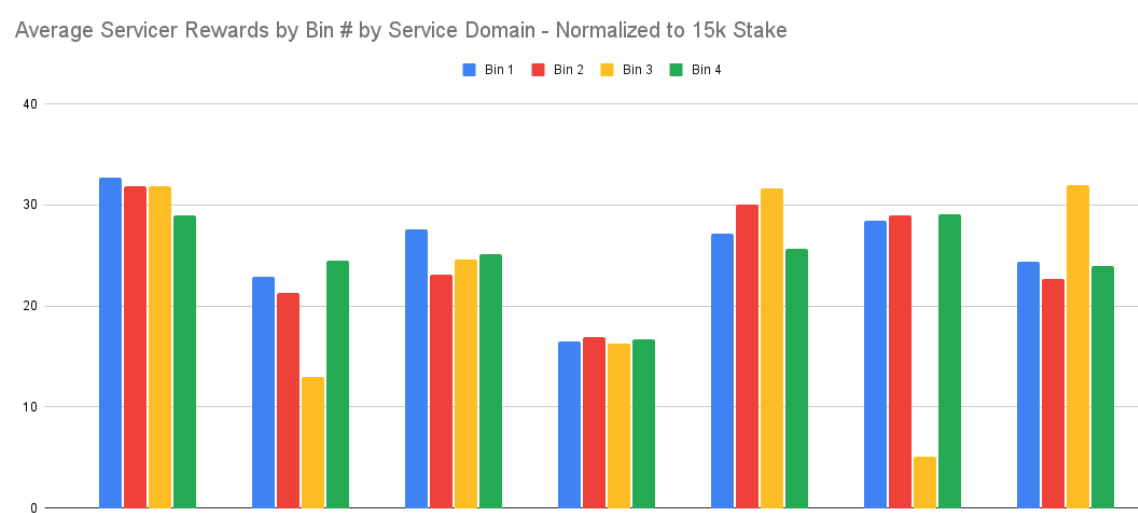
The question I’m trying to answer is:
Is it better to stake 15K, 30K, 45K, or 60K nodes? Or, does it make no difference?
This is what I’m most interested in knowing for sure. So, the test is looking at this question with a 1.8M POKT staked in each of the bins (15K, 30K, 45K, and 60K). As I understand how PIP-22 should work, it seems to me that all of the cohorts should result in the same or nearly the same rewards over some period of time - which I know needs to be determined also.
Each of the four cohorts is split evenly across two servers. The purpose of the split was to simulate a lower end and a higher end config. Both of the servers are dedicated servers (so no other apps are running on them) that are running Lean Pocket . The general hardware configuration is:
Server 1 (higher-end config)
-
CPU: 16 Core x 3.0 GHz (AMD Epyc 7302P)
-
RAM: 128 GB
-
Storage: NVMe (2 x 960 GB Hardware RAID 1)
-
Location: Philadelphia
Server 2 (lower-end config)
-
CPU: 8 Core x 3.6 GHz (Intel i7-9700K)
-
RAM: 64 GB
-
Storage: NVMe (2 x 960 GB Hardware RAID 1)
-
Location: Saint Louis
Both servers have the exact same chains.json file so all of the nodes are relaying to the exact same RPC endpoints.
NOTE: The goal of the test is not to optimize for rewards but rather to test PIP-22. If it was optimizing for rewards we would use different chain.json configurations / relay node endpoints that we know would perform better.
If there is anything more you’d like to know about the test setup, I’m happy to answer any relevant questions.
3 Likes
I love the openness and fairness of your test, but unfortunately, I don’t think it’s anywhere near large enough to achieve statistical significance in the next few months.
Even your largest bin (120 nodes) only represents ( 120 / 30,000 ) less than 1/2 of 1% of the network. That’s equivalent to testing one block every two days for the network as a whole. And as msa6867 has pointed out, the network node composition will be changing during the this period of time, which will necessitate an even larger sample to achieve the same level of confidence.
The problem gets worse because the net difference (18%) which PUP-25 claims to exist, Is claimed by other to be ±10% and by others to ± 3.5%. The SWMM adjustment factor has a greater impact than that. The lower the “true” difference is (if -in fact- there is any difference), the harder it will be to get it to into focus.
Now for the good news…sort of:
Although I cannot provide a time estimate of when your data will have significance, I can give you a way to determine when your sample siz has reached a level that it is no longer meaningless. That is:
Measure the internal variance of your 120 node bin using the same sample size as that of the comparison bin (30).
How to do this:
1.) cut the 120 node sample into 8 different pre-defined sub-sets:
Set one: numbers 1-30
Set two: numbers 31-60
Set three: numbers 61-90
Set four: numbers 91-120
Set five: every fourth node IE: 1,5,9,13,17 etc.
Set six: every fourth node +1: IE 2,6,10,14,18 etc.
Set seven: every fourth node +2: IE 3,7,11,15,19 etc.
Set eight: every fourth node +3: IE 4,8,12,16,20 etc.
As long as the absolute value of difference between ANY TWO of the eight sets is greater than the difference between bucket 1 and bucket 4 your data is 100% insufficient. After it reaches the point where the max difference between your internal sets and the bucket differences you can subtract the max difference from the bucket difference and get an idea of what the data is saying. (Note: this does not imply significance it just lets you read it correctly)
3 Likes
Sorry, I was long winded. My answer is a solid yes, with the same caveat that @benvan raised. With the added caveat that if the system behavior changes substantially over a time period needed to gain statistical significance, you’ll have to find creative ways to factor out the effects of the system changes.
I like your setup. Are you gathering CP data (median latency, P90 latency, success rate etc)?
The controlling sample size is 15. Pretty small, Two months may or may not be long enough. As you gather data and want to visualize results, here is a convenient way to graph the data to quickly visualize how far you are on the road to gathering enough data:
- Randomly assign each group of 30 30k nodes into 2 subgroups
- Randomly assign each group of 60 15k nodes into 4 subgroups
- plot the subgroups against each other (within a single bin/server combo)
- Once the variation within all the different subgroups becomes negligible for many days in a row of adding to the cumulative data set, you can be fairly confident that you have collected enough data.
I would really like to see some other providers join the fun. I don’t think there are any that can give any more bin 2 and 3 coverage than you are providing, But I know there are at least three providers that could do a bin 1 vs bin 4 comparison set up with 10x or more the sample size and I would encourage them to do so and report their results, also.
Could you elaborate on the divergence between optimizing for reward vs optimizing for gathering test data. I can guess (“we chose chains known to have the highest USE1,2 volume” or “we chose chains known to have the least demand-side variation day to day” or “we chose chains known to have the most supply-side competition from other nodes”)… but I would love to hear directly from you rather than guessing.
Also, I will go back and reiterate what @beezy said earlier. In addition to all the time and effort going into the test, if you are foregoing optimal rewards in order to conduct the test, then the DAO should reimburse for the loss of income you are incurring by doing so, as this is a service to the community as a whole.
1 Like
I love good news - even when I don’t fully understand it. ![]()
So, I won’t pretend I know why you think what you outlined will work (and no need to explain). But the fact that you’re providing a path to getting an objective result makes me happy.
So, if you know all of the addresses of the nodes in the test, can you:
- Tell us if you feel the sample is meaningfull
- Let us know how much more we’d need to stake if our sample size is too small
I don’t need to understand the math/statistics - I’d just like to get consensus on what an objective test looks like.
2 Likes
I think @benvan and I are giving more or less the same path forward but in different words. Can you provide a csv with cumulatives to date . Eg:
address stake amt location cum rewards
If you provide a link to that data, then either @benvan or I (or both of us independently) could probably turn that around in an hour to post a visual (either privately or publicly at your discretion) to see how much variation there is between the randomized subgroups we are speaking of and consequently, how far you are on the road of gathering sufficient data.
This will be a much more efficient use of time than only giving addresses and having to go and regather all the data block by block that you have already gathered .
Or, equivalently, if poktscan has been gathering this data, you can just let the poktscan team know that they have your permission to share the collected data with me and they an get a csv to me on our private channel
1 Like
At this point we have not agragated any data. We just staked the nodes in the cohorts and we’re tracking the rewards using the blockchain data. The blockchain is the source of truth so shouldn’t it be used as opposed to a generated .csv?
I will try to make a quick reply now to clarify some points. The confusion regarding our proposal is clearly shown here:
Our unfairnes claim has nothing to do with the differences claimed by others. I think that he is talking about the discussion arround the averages per bin.
This is a shortcoming in our side for not being able to reach all the comunity. We will try to create an infographic to clear this on monday.
The experiment thats being run by @steve will help us to have some common ground for all to make tests, thats wonderfull. Regarding the experiments that you are proposing, I think that they are fair and they will prove the things that we already know (I hope so).
The different bins are eaning what we expect them to earn. Remember that when you are calculating an average and you want to know how accurate is your measurement you can use the standard error of your means (its really simple and robust). In your experiment your samples are the sessions of your nodes. This holds as long as your nodes are all the same (they are the same random variable).
The experiment proposed by @BenVan and @msa6867 will help you to know if the nodes are infact all equal. More formally, it will tell you if the supposition that they were all the same random variable is true or not. As he says, proving this will require more time as the samples will become more scarse after partitioning your data. Personally I dont think that this is requiered, your set-up seems consice, but this is only an opinion and cannot validate anything.
An other point that I want to clarify is that we dont need to measure the whole network, it possible to calculate this metric with steve’s group of nodes. You don’t need to take my word for this, the error of the means will speak for themselfs.
We are tracking this, and with @steve permission we could disclose it if he deems it necesary.
Yes we have been tracking the data and it is steve’s data, we can meet and discuss if and what he wants to share.
To finish this post I want to repeat that the issue that we are refering to in the core of our document will not be observed by this experiment. Please give us some time to create an infographic to clarify why is that. It will just be a couple of days.
1 Like
Alright, I think @BenVan, @msa6867, and @RawthiL are all saying that a conclusive test is possible. Now we just need to agree on the number of nodes needed (sample size) and the required duration (how long the nodes need to run for).
So, how do we agree on what the sample size needs to be and the duration of the test?
Please try to keep your answer as short and simple as possible for those of us with smaller brains and other time obligations. ![]()
2 Likes
I agree. Nonetheless, if there is a clear QoS differential between the nodes in the two locations, I think the experiment will yield some very valuable insights nonetheless, some of which may help us in optimizing the cherry picker.
Keep exactly as is for now and let’s see where things are at. Just give the word to @RawthiL et al that they have your permission to share their collected data. Once I get the data I’ll share a snapshot of where things stand in terms of data collection
So, just to be clear @msa6867, are you saying that you think the current test will produce an objective result? I’m still reading some ambiguity in the “let’s see where things are at”. This suggests to me that at some point in the future you might come back and say the test was not set up correctly. That’s what I’m trying to avoid here. Looking for a confident ‘yes’ or ‘no’ - if it’s a ‘maybe’ then the results could still be seen as subjective.
The current test is setup correctly. The unknown is how long data collection must be carried out to obtain interesting results and how much system change happens over that period.
Once I see the current data that has been collected I can let you know right away (not some point in the future) how close you are to collecting enough data. I would report something like the following (after replacing these placeholding values with actuals from the data):
“After collecting data for 14 days, the variability based on pure randomness stands at 10%. Based on this we can estimate that by extending the experiment for a complete two months, this should reduce to 5% variability of pure randomness. Therefore one can expect that after two months of collecting data any difference of rewards between bins that is significantly greater than 5% means that there is a real difference of rewards based on which bin a node is in, whereas any difference that is around 5% or less means that within an unknown of ±5%, there is no evidence of any difference in rewards based on bin number.”
Since it is your experiment, it would then be your call as to whether that projection is tight enough for your liking. If the projection is that you will get your answer to within ±5% and that is good enough for you, then your would continue as is. If you say that you really want to know an answer within ±2%, then you will probably have to up the node count or duration or both.