Given our conversation in private I think that the actual question here is:
How do we calculate the impact of new gateways in the block size?
Well, good news, its very simple. I will dump values here and then justify them later.
The block size used by a new gateway, with ~96% confidence is given by:

with:
where:
mean claim size = 2.4944 KB (obtained empirically, 1% error)mean claims per block = 5std claims per block = 2.1044
To illustrate this we will use “Nodies”, a gateway using a round-robin strategy with their apps (worst case scenario). Nodies has applications = 20 and services = 8 per application, then, the formula is filled as:
mean block size = 5 * 20 * 8 * 2.4944 KB = 1995.54 KB = 1.94877 MB
std block size = sqrt(2.1044**2 * 20 * 8 * 2.4944 KB) = 42.04 KB = 0.041 MB
Expected block size of “Nodies” with 96% confidence:
1.948 MB +- 0.082 MB
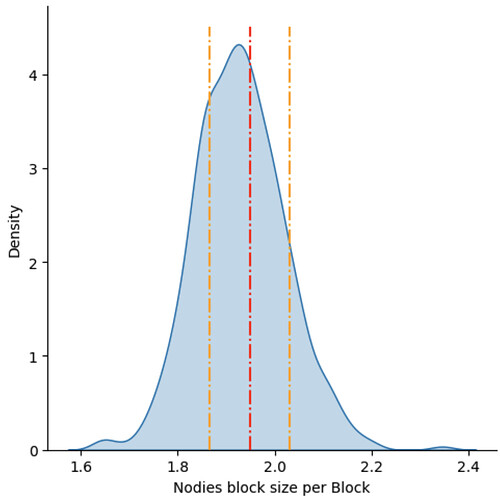
Lets contrast with data:
The distribution is the block size imputed to “Nodies” claims+proofs in the last 500 blocks that were analyzed in this thread. The red line is the average, the orange ones the expected 96% confidence interval.
Not bad if you ask me…
So, by using the provided equations we can know beforehand and in the worst case how much block size we will be needing to accommodate the new gateways. The foundation will need to do the math as the number of apps and services will depend on the contracts being signed.
Now, if you want the full justification, follow me…
Dataland!
Assumptions
The first step to analyze the impact of the gateways in block size is to assume that the only component that affects the block size is the number of claim+proofs. This is not exactly true, since txs also impact block size and there is a minimum size of around 400KB. However, as we shown before, the effects of txs is minimal and the effect of the 400KB minimum is diluted as the block size grows. This means that this assumption is not heavy and in the end we are only being pessimistic, which is good in this context.
So, from now own, the total size of the block is directly proportional to the number of claim and proofs observed. Also, the number of relays being claimed plays no role.
Imputing Block Size
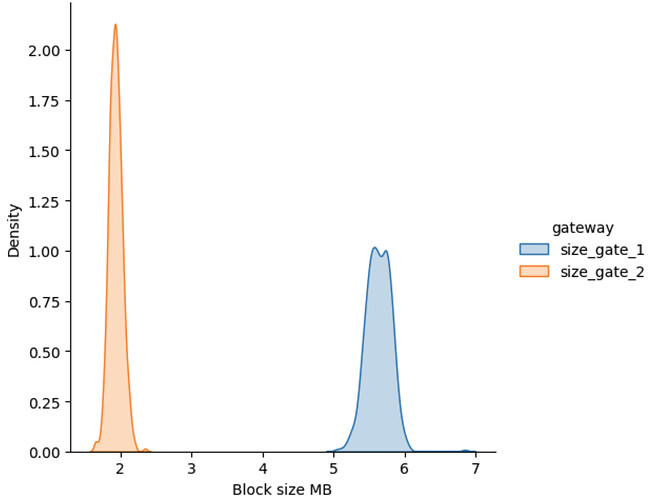
The first thing that we need is to analyze how the current gateways use the block space. Using the sample of 500 blocks, we plot the distribution of the block size imputed to each gateway in each block:
As expected the gateway 1 ( “size_gate_1” ) dominates the block size, this is “Grove”, having ~70% of the block. We also note something very important, the distribution of “Grove” is not perfectly normal, it has some degree of bi-modality, while the “Nodies” distribution is much more normal.
Comparing Gateways
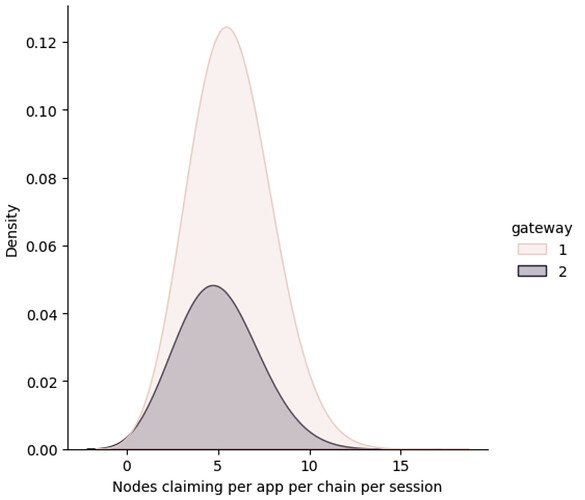
We need to know the cause of this difference in distributions. So the first thing that we can analyze is how many claims each gateway generates each time one of their apps has a session. So we plot that distributions:
We can see that both distributions are really near, which means that there is no explanation here for the observed difference. Both gateways have almost the same average of producing 5 claims ± 2 claims per session. Which makes sense, they use almost all nodes in a session most of the time that they decide to use an app. The numbers check out as only 1/4 of the nodes in a session claims at each block so, 5*4 = 20, add the dispersion to that and we are near the 24 nodes per session.
So, both gateways always trigger the same number of claims+proofs per session, the question is now, do gateways always use their sessions?
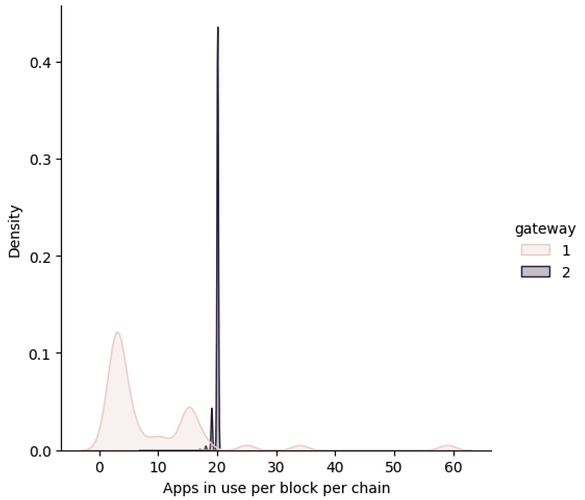
To answer that we will plot the distribution of the number of apps that are being used at every block (which correlates to session in modulo 4).
Voilà! We can see that “Nodies”, gateway 2, almost always uses the session that their 20 apps produce, while “Grove”, gateway 1, is using a different strategy. The strategy used by “Nodies” maximizes the number of claims+proofs produced and also is very stable, we believe that they do a sort of “round robin”, using all their stakes for every chain at every time.
Knowing that “Nodies” is so stable is very important to contrast the model being developed, on the other hand, the strategy of “Grove” creates complex block size distributions that would require to go much deeper into the data. So, this is our lucky day.
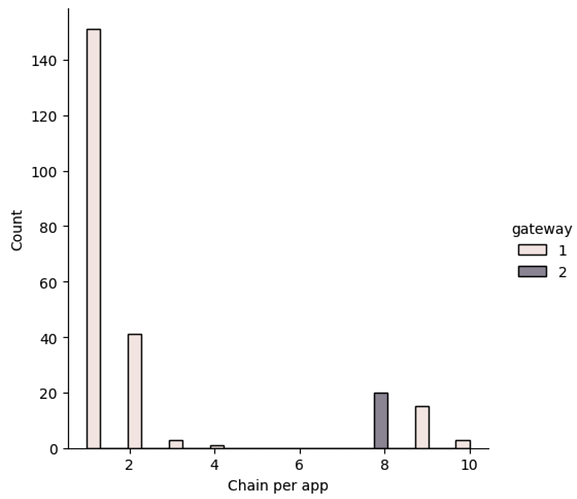
A final, but also important part of this experiment is to test that “Nodies” is always using all their chains. So, we plot that distribution too:
Bingo, “Nodies” has a singleton distribution, they always claim for 8 services, while “Grove” has a more distributed strategy.
The Model
The worst case scenario for block usage is that a gateway uses all their applications, for every service, at every session and triggers claims for each node that is paired with them.
As we have seen, “Nodies” is doing this, they have 20 apps, which appear at almost every block (they are always used) and when they appear they trigger claims for 8 chains (all their chains) and for almost every node in the session (5±2 node claim per block ~> 24 nodes every 4 blocks). Thank you “Nodies”? (I have mixed feelings hahahaha)
The case is that using a simple measure of the imputed block size to “Nodies”, provide us with a very stable measure of the size of a claim, approx 2.5 KB with 1% dispersion, and more importantly allows to check our model that says:
“The maximum number of claims+proofs observed in a block coming from a gateway is equal to the number of apps multiplied by the number of chains that the application serves, multiplied by the number of nodes in the session divided by the number of blocks per session”
Mathematically:
Claims+Proofs = Applications * Services * Nodes per session / 4
then:
Block size = (Claims+Proofs) * size of tx
The proof of this was shown at the beginning of this post, where the “Nodies” inputted block size has a high overlap with the expected size using this simple (worst case scenario) model.
