Edits:
- 22/02/2024 : Corrections and added more data splitting the sample by gateway.
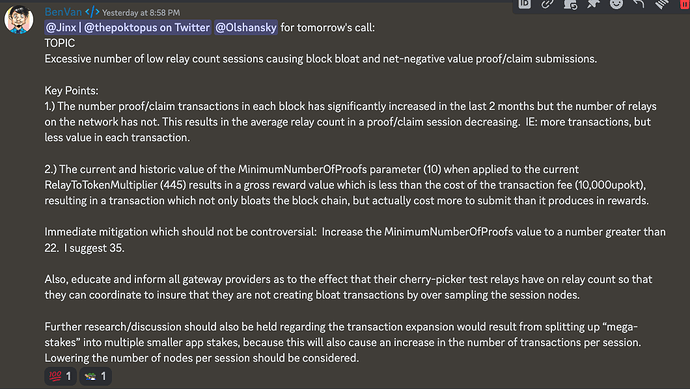
The intention of this thread is to share data on the issue raised by @BenVan on Discord.
I will try to follow @Olshansky proposed format.
What’s the problem?
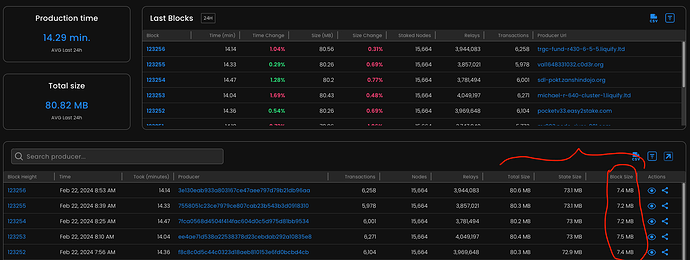
Block size is increasing, currently at ~7.5 MB out of a maximum of 8 MB.
Things node runners could / should do
Node runners can activate the pocket_config.prevent_negative_reward_claim parameter available in the last version of Pokt. However this won’t fix the issue, less than 0.2% of claims meet the prevent_negative_reward_claim condition.
I believe that no other action can be done by node runners without working against their economic incentives.
Things gateways could / should do
Re-think their relay load balancing strategies.
I don’t know much about how and what they do, but there is a clear change in the distribution of relays. The number of total claims/proofs increased 2x since the 2023-10 (before second gateway).
We have no information to tell if the addition of the new gateway is the source of this or if it roots in the ever changing Quality of Service (QoS) and routing strategies of gateways.
List of parameters we could change on chain
IMPORTANT NOTE: This is an exhaustive list, NOT A RECOMMENDATION. It is here just for visibility.
pos/BlocksPerSession: Increasing the blocks per session reduces the number of claims/proofs that are the bulk of the block size.pocketcore/BlockByteSize: Making the block bigger to get more space.pocketcore/SessionNodeCount: Reducing the nodes in a session will reduce the number of nodes posting claim / proofs.pocketcore/MinimumNumberOfProofs: Increasing the minimum number of proofs to submit a claim will reduce the posted claim / proofs.auth/FeeMultipliers: Setting a higher fee for claims will disincentivize the nodes from posting claims for fewer/cheaper relays (they would loose money).
Collected data
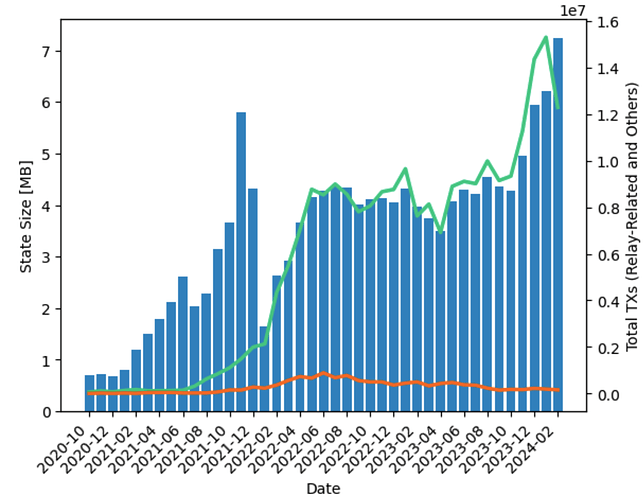
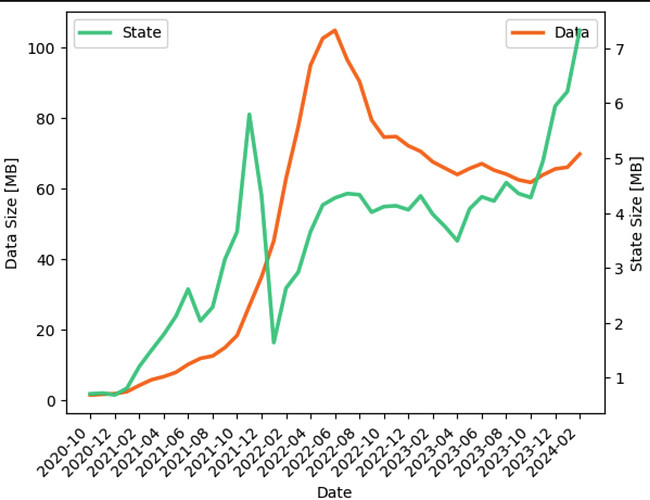
Block size evolution since height 8000
The blue bars represent the block state size, the size can be read using the left Y axis.
The green line represents the number of TXs that are caused by claims ans proofs. The orange line represents the reminder of the TXs in the network. The number of TXs for both lines can be read using the right Y axis.
Its important to note that the second gateway was introduced in November 2023 and it correlates with an increase of the block size from ~4.5 MB to ~6 MB. Once more, correlation does not means causality.
In the last month, the block size has jumped again, reaching a critical value of ~7.5 MB.
The number of transaction that are not related to relays (i.e. wPOKT) does not seem to have growth in a meaningful way, this is probably not the source of the problem.
Distribution of the number of relays per claim
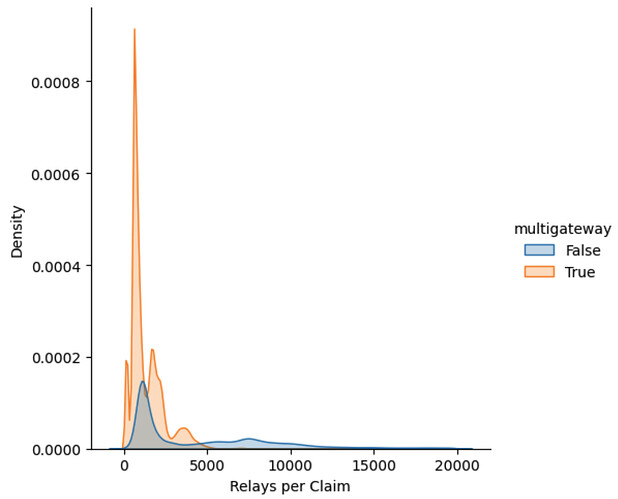
This figure shows how the number of relays per claim is distributed. A higher “Density” values (Y axis) means that more claims (in the sample) have the amount of relays indicated by the X axis. The colors indicate if the sample corresponds to the multigateway network or not.
We call “multigateway” a network with more than one gateway. specifically:
multigateway=False: A period of 500 blocks in October 2023, specifically from block 111000 to 111500. In this period only Grove was online.multigateway=True: A period of 500 blocks in February 2024, specifically from block 123187 to 122687. In this period Grove and Nodies were online.
We can see that the distribution shifted notably in these two different samples. Before (blue distribution) there was a larger number of claims that packed from 5000 to 10000 relays each, now (orange distribution) almost all claims pack less than 5000 relays, and most of them pack only ~1000 relays.
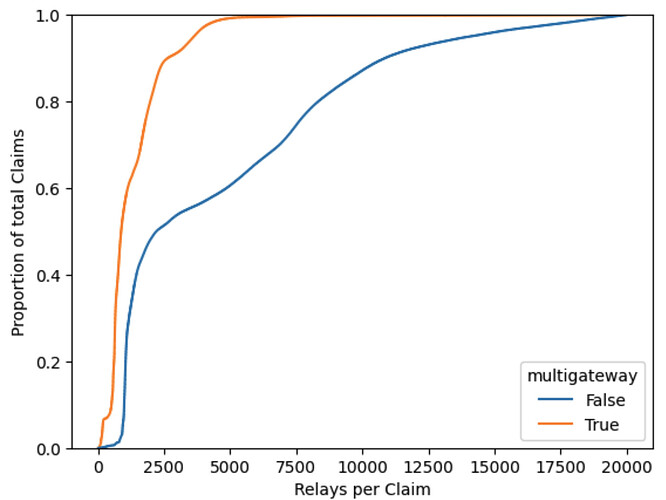
The same information can be seen by means of a cumulative distribution plot:
We can see that the current state of the network has most of their claims filled with less 2500 relays, actually, the orange trace marks that more than 80% of the claims have 2500 relays or less, while before (blue trace) only 50% of the claims carried this amount.
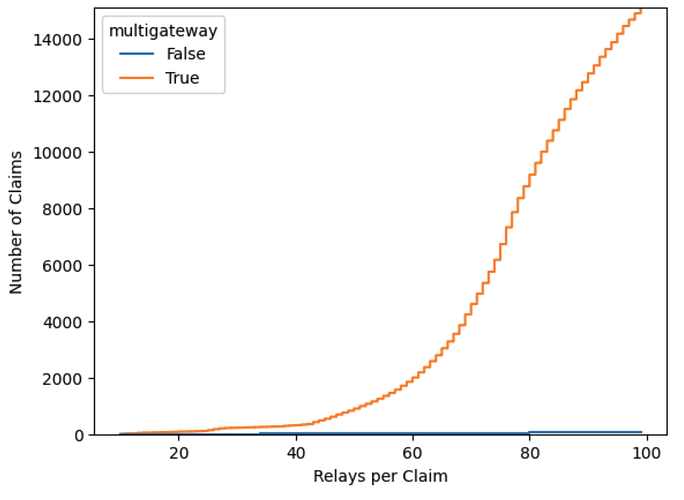
Its important to remember here that the reduction of the free tier occurred in this same period, in November 2023 the average by day was ~1 B relays. This can partially explain the change in the number of relays by claim. What it cannot explain is the tails near the zero of the cumulative density plot. We can look closely at the number of claims that had less than 100 relays and count their numbers:
When we compare these tails, that highlight the amount of low-relays claims, we see that the difference between the samples is remarkable, This is probably due to a change in the way that gateways work, regardless the amount of relays.
Number of Claims and Thresholds
Here we analyze the number of claims in both samples of 500 blocks (before and after multigateway). In the following table we show the number of claims that resulted in minting less than the total fees (we call them “backfire” since the node runner lost money), the number of correct claims (that resulted in revenue) and the proportion of these two groups.
| Backfire Claims | Correct Claims | Proportion | |
|---|---|---|---|
| multigateway | |||
| False | 0 | 738827 | 0.000 % |
| True | 3307 | 1549049 | 0.213 % |
We can see that the “backfire” begun after the introduction of the new gateway, caused probably by the number of claims that are now packed with very few relays. Its also important to bite that the total amount of claims almost doubled (just like the block size, causality here) despite that the total number of relays in the network was sharply reduced (almost a half today compared to October 2023). This could be partially explained by the extra apps that the new gateway is using.
From this table we can tell that activating pocket_config.prevent_negative_reward_claim wont solve the problem.
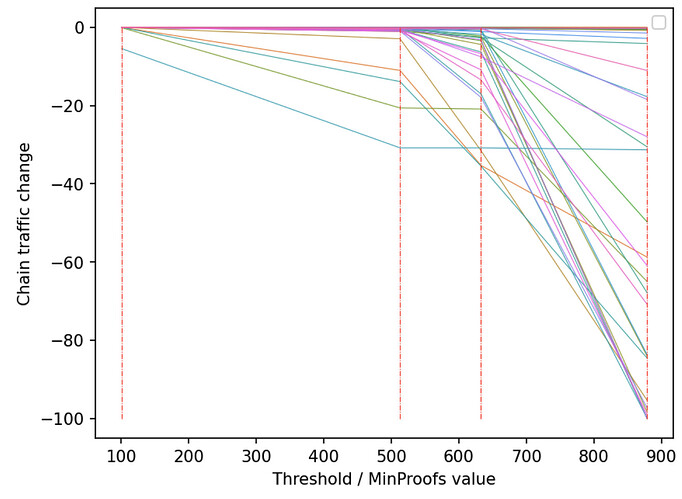
If we were to set the pocketcore/MinimumNumberOfProofs higher, it should be much higher than expected to reduce the number of claims in a meaningful way. This is observed in the following table
| Percentile | Threshold value (number of relays) |
|---|---|
| 1 % | 101 |
| 10 % | 513 |
| 25 % | 633 |
| 50 % | 879 |
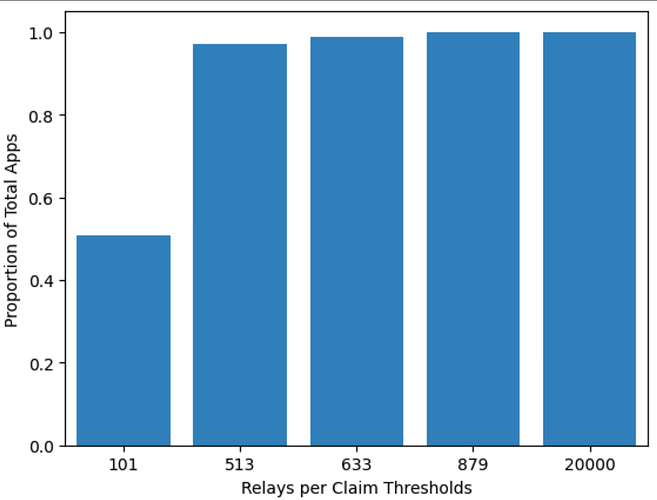
For clarity we calculated the total proportion of apps that produced claims in each of these thresholds:
It can be seen that after the second threshold, corresponding to the 10% percentile, almost all apps are included. In other words, ~99% of all apps produce 90% of all relays. This indicates that the low-relay claims is not fault of a given set of apps.
By Gateway Data
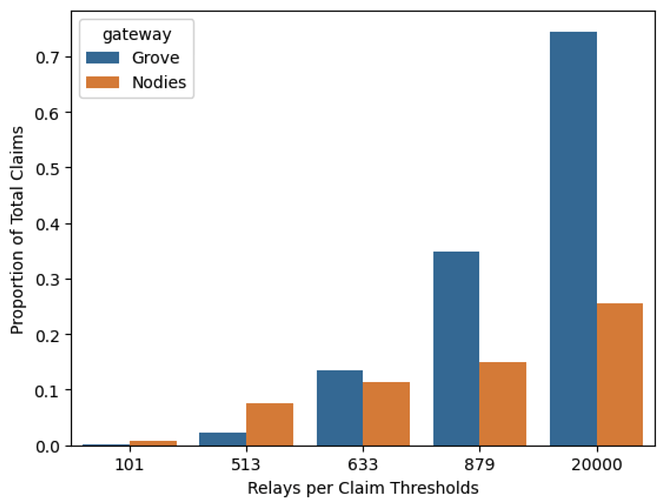
Using the thresholds/percentiles presented in the last section, we proceed to create a view of the number of claims corresponding to each gateway.
In this image we can see that the claims in the lower threshold values (from 1% to 10% percentiles) originate mostly in the Nodies gateway.
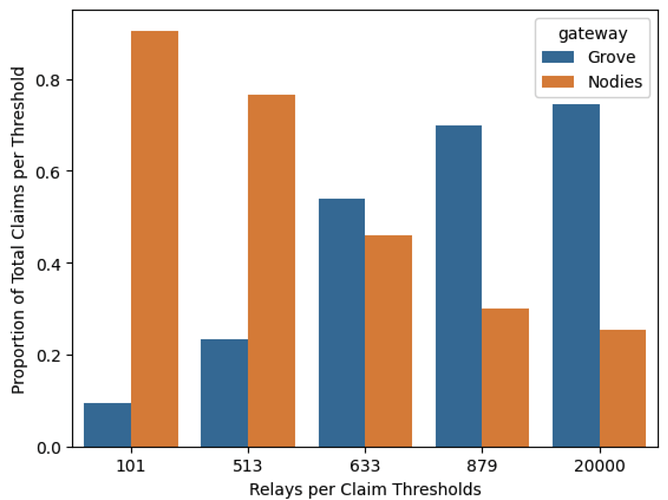
Also lets look the proportion per each threshold, this will represent how many claims do we cut from each gateway if we apply the given threshold.
How Shannon solves this
Not sure, Probabilistic Proofs Relay Mining only solves for high number of relays, no low.
We should set some higher threshold and compensate by distributing rewards using the total session relays (a hybrid approach between salary distribution and claiming).
I need more time to think…
