In order to boost transparency into the revenue coming from Pocket’s protocol, we’re sharing our initial Protocol Revenue Report.
These reports will highlight protocol revenue specifically, as opposed to any other PNI sources of revenue. Protocol revenue represents the total RPC fees paid by demand-side users who request network throughput via the protocol. You can see more on the app economics in the docs.
Note: In the future, when the DAO institutes Application Burn Rate (ABR) (which is expected in the maturity phase), these demand-side fees that are used to acquire POKT will be app-staked and burned as requests are consumed. To maintain network throughput, the user will need to top up their stake accordingly. Currently, these customers pay via dilution vs. the future ABR.
We’ll keep it brief and simple with these reports, sharing:
- Sources and dollar amounts of protocol revenue (dApp RPC sales (B2B), Gateway as a Service (B2B2C), Pocket Portal’s Pay As You Go (B2C), etc.)
- Amount of POKT that is (1) currently app-staked and (2) set to be acquired & staked
- Some key highlights and a quick look at the pipeline
This report excludes additional revenue sources of PNI, which include but are not limited to: new network acceleration fees, MEV (maximal extractable value), and node running rewards.
Given Pocket’s focus on protocol monetization not truly beginning until mid-Q3 of 2022, this initial report covers about 4-5 months of time, rather than a true half-year, but we’ve chosen the “H2” phrasing for simplicity’s sake. Going forward, we expect to share these types of reports on a quarterly basis, in the first month following each quarter’s end.
Protocol Revenue and POKT App Stakes:
With the housekeeping out of the way, first up are the different sources and dollar amounts of protocol revenue. With the exception of the Portal revenue, all the other revenue was closed by the Marketplace team via direct selling to companies, projects, and foundations.
| Product Offering | H2 2022 Protocol Revenue |
|---|---|
| dApp RPC Sales | $427,000 |
| Gateway as a Service (B2B2C) | $49,000 |
| Pocket Portal (Pay As You Go) | $1,000 |
| TOTAL | $478,000 |
Next, the POKT staking/acquisition numbers as of 1/17/23, defined as:
- POKT Currently App-Staked: This is POKT that has been acquired in the market by customers or has already been acquired by PNI (via the market maker for POKT) on behalf of customers.
- POKT To Be Or Actively Being Acquired: This is the remaining POKT to be acquired on behalf of customers.
| POKT Currently App-Staked | 5,776,785 POKT (88%) |
|---|---|
| POKT To Be Or Actively Being Acquired | 752,355 POKT (12%) |
| TOTAL APP STAKED DEMAND | 6,529,141 POKT |
Key Highlights and Notes:
Below are some of the noteworthy points of context to go along with this initial report.
- The dApp RPC sales revenue included 9 separate deals, with 2 of those being multi-chain and the remaining spread across 6 different networks. These ranged from DeFi and wallets to new L1s, with the Status deal and Klaytn Foundation deal being especially nice wins for Pocket.
- The average deal size for dApp RPC sales was ~$50,000.
- Gateways (fka GaaS) revenue included 2 initial deals on the ETH network, an encouraging start for this new go-to-market motion and customer segment that has come into sharper focus recently.
- Portal revenue from the Pay As You Go (PAYG) tier came from 90 unique paying users since October 2022. PAYG revenue bumped up in December, with that month accounting for about 50% of the Q4 PAYG total.
- Note: with the exception of Portal PAYG revenue, you can follow the Marketplace team pipeline here.
Overall, these stats represent the first major steps towards monetizing the Pocket protocol, and reflect different adaptations in focus throughout 2022 - with one of those adaptations being an organizational-level shift towards exploring more direct sales. As we expand past the Portal PAYG revenue to more Direct Sales deals based around our Software as a Service pricing, and as we shift towards wholesale relays through our Gateways product (formerly known as “Gateway as a Service”), there is a large pipeline set up for conversion in 2023, with more than 90 open opportunities and a dozen plus partnerships.
You can see the full pipeline dashboard here.
How does this stack up relative to other Web3 infrastructure protocols?
According to web3 index, if we take the prior 90 day fees * 2 (for an H2-22 estimate) that would put the top revenue generator as STORJ. Despite POKT generating 25% more protocol fees over STORJ, our FDV remains 39% lower. It’s a similar, but more pronounced, picture with GRT (which is a more comparable data protocol). There are always many other factors to consider, but this is a high-level proxy for web3 market comparables.
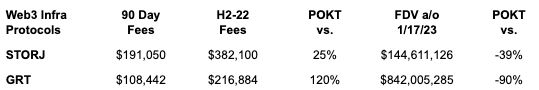
Data reference: STORJ and GRT fees from web3 index, POKT and GRT FDV’s from CoinGecko, and STORJ FDV from CoinMarketCap.
Note: Web3 index doesn’t yet track Pocket’s app stake demand as fees, since these fees are not fully permissionless on-chain. This will be part of v1.
How can you help accelerate demand-side growth?
As with the rest of the Pocket ecosystem, there are a number of ways you can personally get involved in accelerating demand-side growth. One of the key ways to do so is to take advantage of PEP-46: dApp Referral Program, which pays out an ongoing 5% referral award for those that help bring dApps to Pocket’s paid service.
Pocket’s bounty programs are another way to bring additional talent into the ecosystem (developers) and grow awareness of Pocket’s protocol and mission (content writers) - both of which can translate into further demand-side growth.
That does it for this initial report - for the next one, we will cover Q1 2023 in Q2 and get on track with a quarterly cadence.