To facilitate the exploring of the proposed changes, we have created a small tool that recreates all the graphs in the proposal based:
For those who want it simple!
The tool tries to bring down the proposal to 5 simple questions:
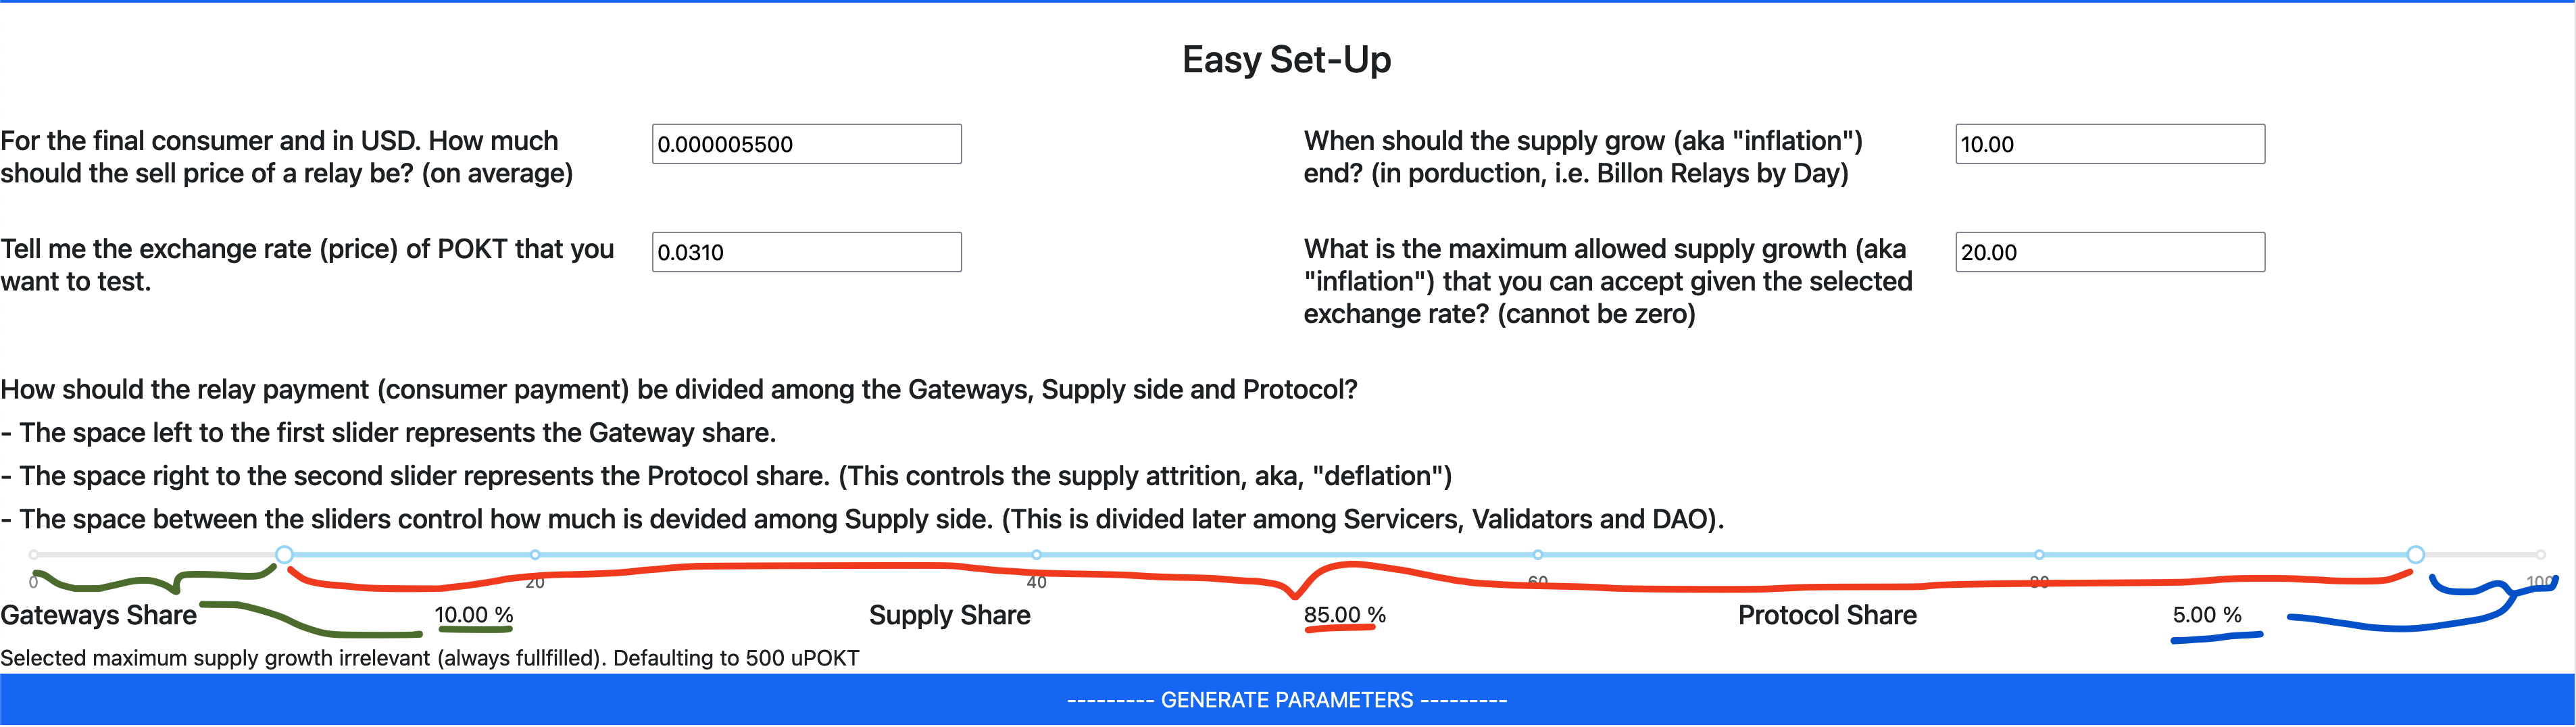
- How much a relay should cost to Pocket Network client
- When should the bootstrapping (by means of lower fees) should end. This is also the golden mark of “deflation threshold”.
- What is the price of POKT that you want to test. All models are impact by this, so use your imagination.
- What is the maximum “inflation” (supply growth) that you want to allow to happen until we reach the “deflation threshold”.
- How we divide the price of the relay among all network participants? Use the slider to define how it is divided. The section in green is how much will be kept by the gateway operator, the section in red defines how much is given to node runners and the last section marked in blue defines how much is absorbed by the protocol. This last part is what will control “deflation” in maturity, if you set it to zero, then we will have “burn=mint”, lower than zero is deflation.
Just hit --------- GENERATE PARAMETERS --------- when you are ready and all the advanced configuration will be filled for you.
For those who want to go deep
The tool enables full control of all the proposed parameters. Feel free to change each of them and explore the results.
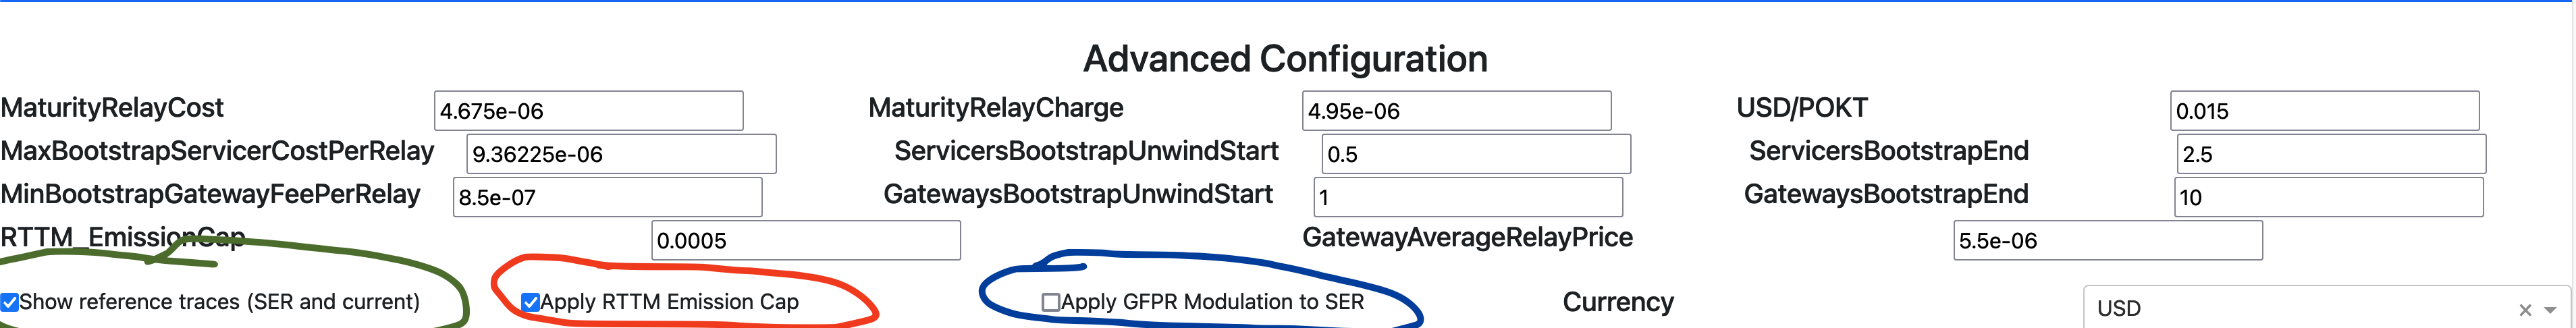
This section includes 3 checkboxes that result in:
- Green: Toggle on/off the reference lines of SER and current states. This is useful for some scenarios where the scale of these lines makes the graphs difficult to read.
- Red: Apply the RTTM cap to prevent the minting to go to hyperinflation levels on extremely low POKT prices.
- Blue: Affect the SER minting to the proposed increased GFPR instead of the fixed GFPR that governs them. I added this for illustration purposes as this scenario is not being proposed and it does not exist.
Results
When you are done configuring just hit --------- CALCULATE AND PLOT --------- and see the results of the proposed parameters.
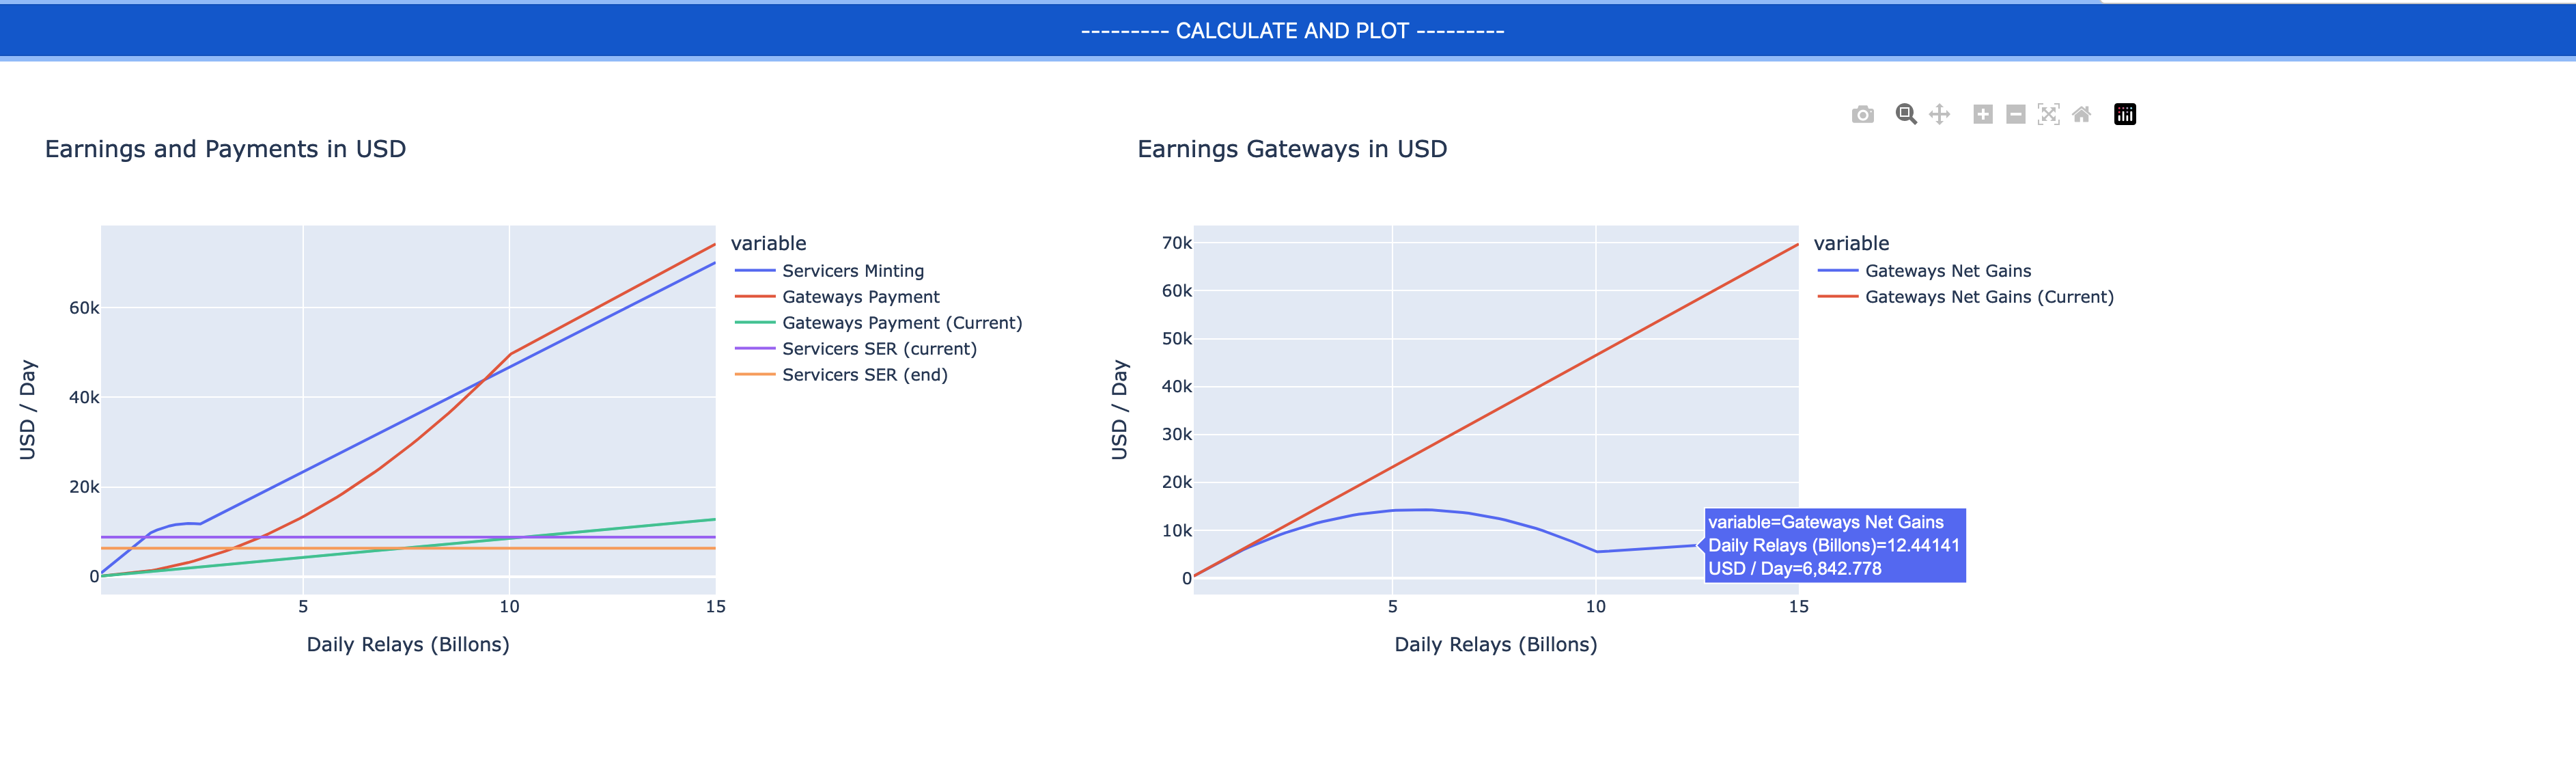
Now the graphs are interactive, you can zoom, pan and see the tool-tips for specific values (who needs spreadsheets…).
Scroll down, there are many graphs. In this picture, the graph on the right is a new one, it represents the earnings of the gateways operators. This was missing in the original proposal and it is indeed important to visualize.
Notes
- If you are lost and messed-up all the values, hit the
--------- RESTORE DEFAULT PARAMETERS ---------on the top of the page to re-load the… default parameters… - There might be some bugs around, please report if you see some weird numbers.
- Yes, graphic design is my passion