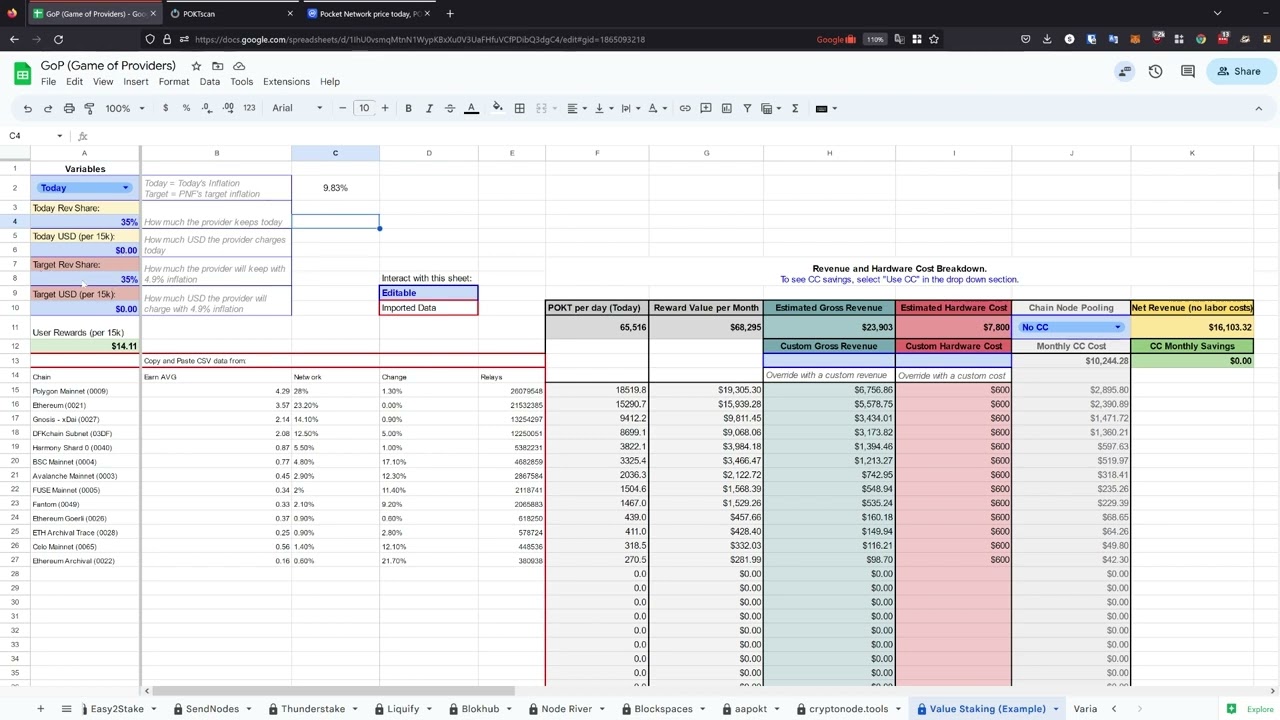
While researching an economic model for chain node pooling, I ended up putting together a lot of data on the node running landscape. Makes sense to share it since inflation/consolidation are hot topics. I hope it contributes to the economic research.
GoP is meant to represent the game theory of POKT's node economic landscape, using public data, and not is meant to be perfect representation. Consider it a research project.
I kept in the chain node pooling economic elements as well to show the benefits of this concept. If you are offended by the concept or Community Chains, please leave the Chain Node Pooling set to no ![]()
![]() GoP (Game of Providers) - Google Sheets
GoP (Game of Providers) - Google Sheets
DISCLAIMER:
Estimated Hardware Cost - Yes, each provider will have different hardware costs so don’t consider this an accurate representation. I am aware that some run at a much lower cost, but $600 a month is a good default for running a chain in all 3 regions.
Estimated Gross Revenue - This is just based off of publicly available information the providers openly share regarding their services. I’m just referencing their own marketing materials. Some providers do not have any public information so I left them blank. Feel free to fill in your best guesses ![]()
Chain Node Pooling - This is showing the savings effect of chain node pooling if every chain was supported, but not every chain is supported yet though CC, so do not consider these numbers to be gospel.
