Attributes
- Author(s): Thunderhead
- Recipient(s): Thunderhead
- Category: Reimbursement
- Related: Pre-Proposal: Pokt Info Reimbursement
- Asking Amount: The POKT equivalent to USD $50,000 (based on 24 hour VWAP at time of transfer) to cover a portion of development and maintenance costs.
Summary
POKT.info (P.I) is a comprehensive analytics tool for node runners in the pocket network ecosystem.
It allows node-runners to take advantage of granular, real-time data to improve the overall QoS of Pocket Network. P.I gives all node runners, small and large, the ability to optimize the performance and rewards of their individual nodes, in turn benefiting the network.
At Thunderhead we believe that providing intricate, accurate data, software tooling and infrastructure to the community is essential to advance Pocket’s growth. We believe promoting collaboration, by sharing resources and information, will allow the community to build upon each other’s work and create new tools for the greater good.
In short, P.I enables nodes that make up the network to be:
- More competitive
- Able to deliver much better QoS to the network as a whole.
- More efficient as node operators can easily find improvements.
At its core, P.I encourages the network to optimize itself - as the transparency granular data brings is a huge boon to node runners who want to figure out how they can be more efficient as well as measure how they are doing compared to the network as a whole.
For example, users can see where specific errors are coming from within specific cache sets to test if competitors are seeing the same errors.
This representation of data is not found anywhere else, by making this resource and the data within widely available, community members and researchers can work together to solve some of the complex problems POKT will face in the future.
As well as this, P.I improves the quality of service of the POKT network overall by reducing monopoly on more detailed, granular data - like errors. This allows new entrants to the network to be more efficient, as well as illuminate for them the inputs to the opaque cherry picker, which has historically confused the network’s node runners.
As far as users go, the site has 45 monthly active users, with spikes to ~100, demonstrating that this is a popular tool amongst the small node runner population and set to continue to be so.
Problem
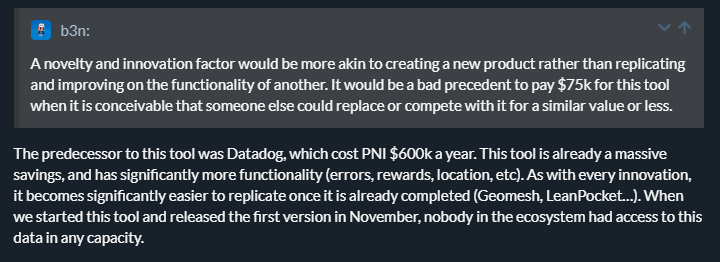
PNI were previously paying $600,000 per year to Datadog in order to visualize a fraction of P.I’s current features. Pokt.Info is an open-source, community-run alternative to this at a tiny fraction of the cost.
As mentioned, the community confusion on the cherry picker was also a huge incentive, and P.I makes this highly transparent with a thorough data set.
Before P.I, nobody had any insight into errors or latency metrics that were behind how many relays or rewards they were receiving, other than on Poktscan’s geo page. However, the page is not as comprehensive (ex: it does not show changes over time) and it did not exist until several months after P.I’s initial release.
The extreme lack of data when operating nodes on the network, combined with the recognition of the limited resources available to core development team around accoutrements that were not protocol specific, motivated TH to build P.I.
Examples of datasets available with P.I
Unlike other analytic tools, the cache set logic P.I employs allows users to select only specific nodes they want to analyze across a data set.
With P.I, you could for example select only the data for say, five specific competing node providers, and only in, perhaps, Singapore and Germany, helping users select highly specific parameters on how and where the network is functioning.
One can also change how the data is presented using a parameter such as block intervals. In this case, a block interval of 4 (or around one hour using 15 min block times) will give your graph lots of data points – good for drilling down use case specifics over smaller time periods - but with spikes, this data may be too noisy for longer term trends.
If one were to select an interval period of 96 (or around 24 hours) they would have a much smoother representation of the data what would be easier to see such trends. P.I showcases these intervals, but also other more granular parameters like:
- Overall cache set: for e.g.; Pokt Network, C0d3r, Blockspaces, Thunderhead.
- Chain specification: As many or as little as the user wants to display results for.
- Regions: For e.g., just central Europe, just east Asia, or perhaps just both of these.
- Block Height: For e.g., just display results ‘from block 87,234’.
Used in combination with P.I’s built in graphs, some of which showcase;
- Relay Count
- Latency
- Success Rate
- Rewards
- Locations
- Errors
These allow for a very powerful representation of data. (See appendix for full feature list)
Pokt.Info Background
The motivation for pokt.info, as mentioned, came from the inability for both existing and new Pocket Network node operators to get granular data on node activity within the network as a whole.
The team are very pleased with the features now available within the dashboard, as In short, P.I currently allows pocket network participants to currently get the most detailed information possible on node running activity globally.
TH have worked relentlessly to make the dashboard come to life over the past year. Without the attention of Thunderhead, many node runners would have far less information, and therefore be far less efficient, in running good quality of service pocket nodes.
Solution & Intended Outcomes
Pokt.Info will help with the future streamlining of node troubleshooting, provide an increase in clarity around network data, and finally improve the overall QoS of the Pocket Network.
Since release, the POKT.info team has provided support, corrected bugs, and added new features to the product. Thunderhead intends to continue to enhance and support the code beyond this proposal by adding new enhancements, features, and fixes as they arise.
We also considered it vital to open source this ecosystem project to avoid privatization for the benefit of a few, which would harm the network overall. Such contributions, we believe, help pave the way to Pocket becoming a more open space for future contributors.
Ultimately, Pokt.info has not only made the network more accessible for those taking part in it, it has increased the value offering of the protocol itself for node runners, investors and PNI, as the QoS of pocket network continues to improve.
Publicly available granular data is essential for Pocket to become a top RPC provider.
Contributor(s)
Thunderhead
Thunderhead has been a contributor to the Pocket Ecosystem since early 2021. Since then, we’ve build out staking infrastructure and open source public goods. We created Thunderstake to provide a white glove offering with the necessities of the modern digital asset fund and ThunderPOKT to increase the inclusivity of the ecosystem by allowing any POKT holder to stake and earn protocol rewards.
As far as open-source contributions are concerned, in tandem with PoktFund, we designed and implemented LeanPocket, a solution that reduced the infrastructure costs of the network by nearly 99%. We also built pokt.wtach, a block explorer, RPCmeter, a RPC latency analytics tool, and now Pokt.Info, an all in one dashboard for monitoring the quality of service of one’s infrastructure.
We gave a talk at InfraCon as well
Deliverable(s)
We delivered an open-source, comprehensive, and hosted dashboard to the node-running community.
Timeline
- Idea, R&D, development & testing: (August 2022 - Present)
- Beta release (November 28th, 2022)
- Feature overhaul (March 17th, 2023)
- Community feedback, collaboration, & bug fixes: (November 28th, 2022 - to date).
Items
- Comprehensive dashboard with a page for reward, latency, relays, errors, and location information, each filterable by every domain, chain, region. (See Appendix for full feature list)
- All services open sourced with documentation detailing setup/install, architecture, and flow
- Common 1
- Reward/Nodes/Location info 1
- Errors/Latency cache
- Main
- Maintained public hosted instance of info and answered all relevant questions/feedback
Budget
The funds sought by this proposal will reimburse Thunderhead for this work and impact on providing community driven products to enhance the Pocket Ecosystem.
Our cost incurred exceeds how much we are asking for. We have the cost of a year of work for one experienced SWE, and expensive infrastructure requirements adding up to the region of $120k. We are now asking for less than 50% of our actual costs, as we believe in the long-term value of the project.
We would have liked to at least cover costs, but in light of the current market TH would accept POKT at $50k USD at time of reimbursement.
Community Feedback
See how various community members have used POKT.info in the discord channels below.
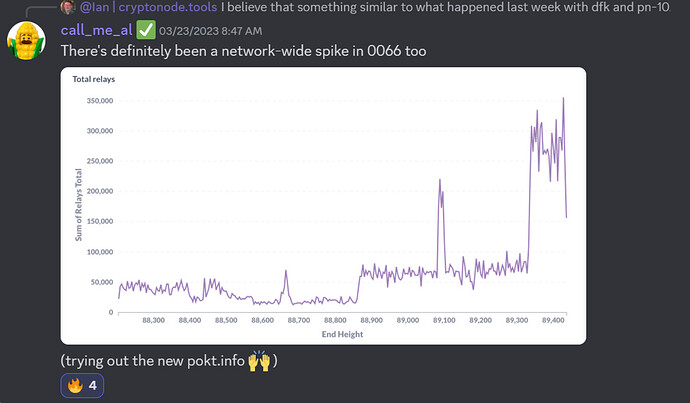
Al uses Pokt Info to analyze unusual Arbitrum Traffic
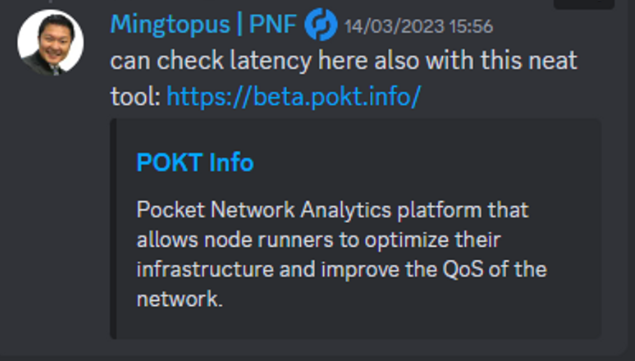
Ming recommends user discussing Celo latency to check it on Pokt.info
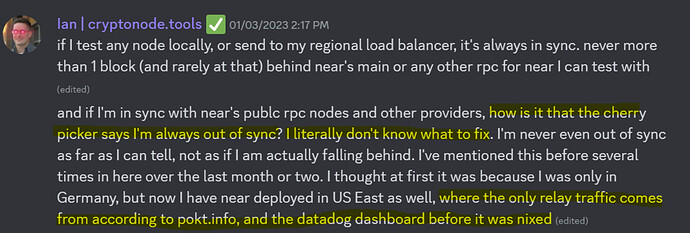
Ian observes that it is often difficult to understand why the cherrypicker behaves how it does, and how he uses Pokt.info to help make this more transparent, as DataDog is no longer around.
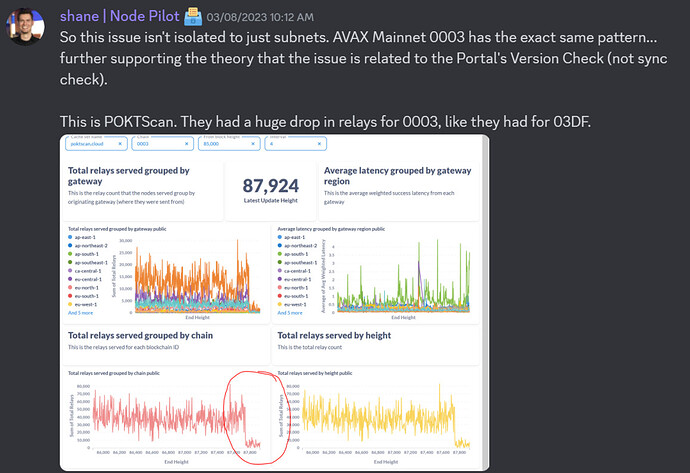
Shane uses pokt.info to easily observe and diagnose network-wide issues
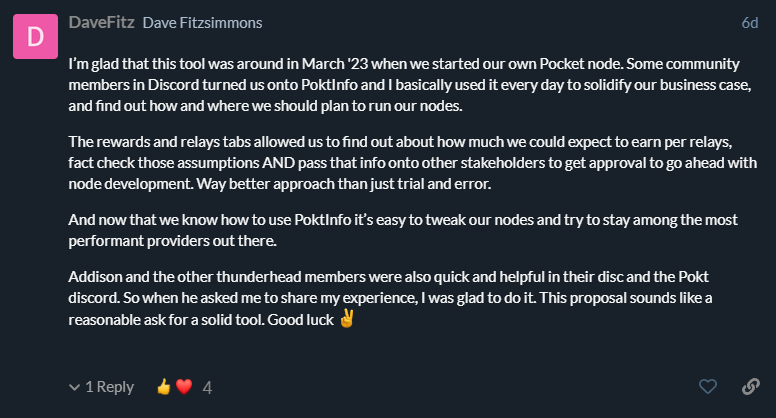
Dave from Knowable VC used P.I every day when standing up new nodes
Don from sendnodes has been helped by P.I on several occasions in node running endeavours.
We would also like to thank the general community for the unwavering support.
Please see our supplementary PNF impact scorecard as well:
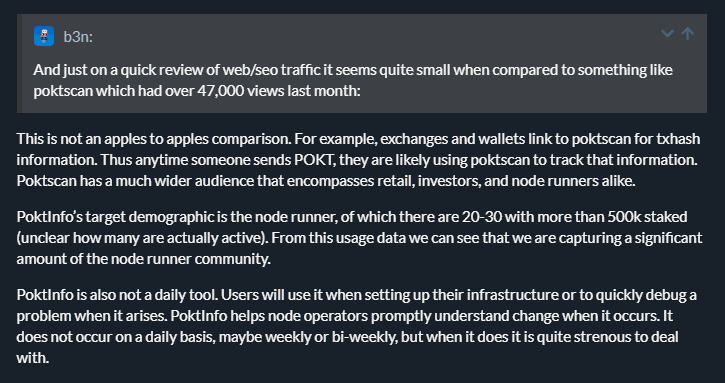
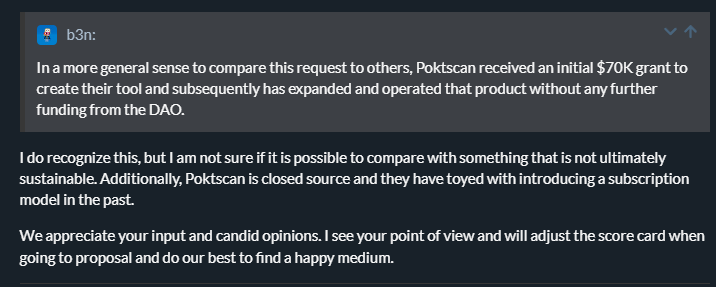
We have taken into account some feedback from pre-proposal, and have revised some scores. However, we have not taken the score down to the level that b3n from PNF requested, as we believe that this is a node runner tool and should not be compared to contributions aimed at wider retail.
We believe that consideration for this project should be based on P.I being tool is for those running running the protocol. As a secondary effect, this benefits everyone from retail, investors and even customers of network gateways. An avid user base of 50 node runners may have huge beneficial knock on effects at scale down the complex chain of network users, gateway providers and investors.
Dissenting Opinions
Upon Pre-Proposal, we were surprised to find some pushback to our initial proposal from PNF, and made a point to clear up some of the concerns. We are happy to answer any feedback.
Appendix; Full list of features:
- Comprehensive dashboard with 6 views, each filterable by every domain, chain, region,
- Main Page
1. Total relays past 24 hours, Average latency past 24 hours, Success rate last 24 hours, sum of total relays by region past 24 hours, average latency by region past 24 hours, sum of total relays over time per region, average latency over time by region, sum of total relays per chain last 24 hours, sucess rate per chain last 24 hours, sum of total relays over time per chain last 24 hours, average latency per chain last 24 hours, average latency over time - Rewards
1. Average relays per node and per chain, Total relays per node and per chain, Average relays per node per chain by provider - Location
1. Count per ISP, Count per continent, Count per country, Count per city, Count by IP, Geolocation map, Node count over time.
2. Additionally filterable by ISP/continent.
3. Geomesh compatible - Latency
1. Average latency per chain, Sum of total relays per chain, Average latency per region, Sum of total relays per region, Sum of total relays over time per region, Average relays per node over time per region, Average latency by region over time, Average latency by chain/region heatmap, Total relays by chain/region heatmap, Average relays by chain/region heatmap - Errors charts
1. Out of sync error %, error msg sum, out of sync error avg per node, Error msg average per node, out of sync error sum, error msg % overtime, out of sync % by chain bar chart. - Errors heatmaps
1. Error msg % by domain, Error msg average per node by domain, Error msg % by chain, Error msg average per node by chain.
